


One advantage you gain with slicers in Excel is that each slicer can be tied to more than one pivot table; that is to say, any filter you apply to your slicer can be applied to multiple pivot tables.
To connect your slicer to more than one pivot table, simply right-click the slicer and select Report Connections from the menu that appears. This activates the Report Connections dialog box, shown here. Place a check next to any pivot table that you want to filter using the current slicer.
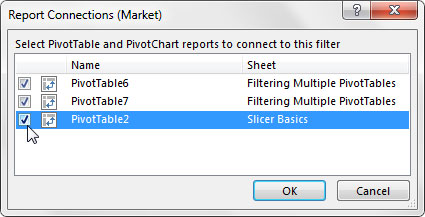
Choose the pivot tables that will be filtered by this slicer.
At this point, any filter you apply to your slicer will be applied to all connected pivot tables. Controlling the filter state of multiple pivot tables is a powerful feature, especially in dashboards that run on multiple pivot tables.


