


Here’s the skinny: Metrics are quantitative measurements, such as the number of views and the click-through rates on your channel. Metrics gauge your goal attainment against your plan. Insights are qualitative and actionable things you learn and do from analyzing metrics — determining whether your YouTube content is working for you, for example, or figuring out whether your interactive cards are well placed in your video.
YouTube Analytics shows you how you’re tracking against your goals and also where you may need to make adjustments. Understanding metrics and insights is relatively straightforward, but you need to know where to look in YouTube Analytics to get the data you need.
As a channel manager, always think in terms of metrics and insights. You must act on those insights, though. For example, if the view count and number of likes (metrics) for your new video are only 25 percent of your target, your video may not be resonating with your audience or maybe you released it at the wrong time (insights). Take the time to fix what may be immediately wrong (such as poor metadata), or change future content or programming. You should monitor the video metrics again over time.
As you become more sophisticated in your use of YouTube Analytics, you realize that certain metrics may depend on other metrics. For example, your earnings metrics may be impacted by view metrics, which may be impacted by engagement metrics. Don’t sweat the details — the relationship among all metrics comes together quickly.Reading YouTube Analytics reports
Your go-to place for all aspects of YouTube Analytics is the Analytics section of YouTube Studio. To make your way there, do the following:- Go to YouTube.
- Log on to your YouTube account.If you see a blue Sign In button in the top right corner of the YouTube home page, enter your email address and password.
- Click the Logged-In icon and choose YouTube Studio from the menu that appears.The YouTube Studio navigation menu should appear on the left side of your browser.
- Choose Analytics from the navigation menu.By default, you should go directly to the Overview tab.
You can also bypass these report-reading steps in YouTube's Analytics.
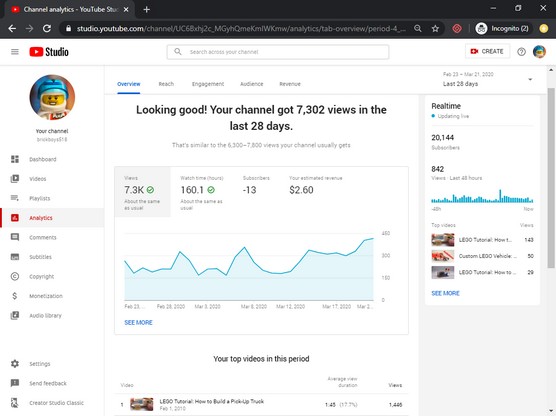 YouTube Analytics overview.
YouTube Analytics is divided into five subsections, indicated by the five tabs running across the top of the screen. They’re described, from left to right, in this list:
- Overview: Presents a high-level view of your channel’s overall performance. It includes the following summary reports:
- Main graph: Data on views, watch time, and subscribers over a specified period. If your channel is monetized, you also see estimated revenue data in this graph.
- Top videos: A list of your top videos for the selected period, ranked by watch time.
- Realtime: Displays your video views and top viewed videos over the past 48 hours.
- Latest Videos: Shows an embedded video of the latest videos you have uploaded, as well as its views, average view duration, and watch time.
- Reach: Displays the overall reach — how many people watched the content on your channel categorized by your different traffic sources, in other words. This section is composed of several summary reports:
- Main graph: Displays the number of impressions, click-throughs, views, and unique viewers your videos have generated over a selected period.
- Impressions and how they led to watch time: A funnel chart displaying how your video impressions led to views and, ultimately, watch time. This report also shows how often, on average, YouTube has recommended your videos to users.
- Traffic source types: Provides a breakdown of where and how often users found your videos on YouTube, such as YouTube Search, suggested videos, channel pages, and more.
- Traffic source: External: Displays a list of websites and apps outside of YouTube that link to or have embedded your video, as well as the percentage of times these sources led to views.
- Traffic source: Playlists: Shows the total percentage of views you accumulated from playlists containing your video and the names of those playlists that led to the most views.
- Traffic source: Suggested videos: Shows the total percentage of views you accumulated from other videos suggesting your content and the names of the videos that led to the most views.
- Traffic source: YouTube Search: Shows the total percentage of views you accumulated from the YouTube Search results and the keywords that led to the most views.
- Engagement: Presents a summary of what your YouTube audience is watching on your channel. It includes these summary reports:
- Main graph: Displays the total watch time and average view duration of videos on your channel over a specified period
- Top videos: Displays a list of your top videos ordered by their watch time in hours
- Top videos by end screen: Shows a list of your top videos, ordered by the number of end screen element clicks
- Top playlists: Provides a breakdown of your playlists ordered by the percentage of watch time attributed to each one
- Top end screen element types: Shows a list of clicks per each type of end screen element type you use
- Top cards: Shows a list of end screen cards, ordered by the highest number of clicks
- Audience: Describes who is watching your channel. It contains these summary reports:
- Main graph: Displays the number of unique viewers, average number of views per viewers, and subscriber growth over a specified period.
- When your viewers are on YouTube: Shows the times of day and days of the week your viewers watch YouTube so that you can determine when to publish your videos or launch a live stream.
- Age and gender: Provides a breakdown of your audience by gender and age bracket based on a percentage of views.
- Subscriber bell notifications: Shows the percentage of your audience that has turned on all notifications for your channel. Also displays a typical channel benchmark range for this action on other YouTube channels.
- Top countries: Shows what countries your audience is located in, based on a percentage of views.
- Top subtitle/CC languages: Displays your audience’s usage of subtitles as well as which languages are most frequently being used based on a percentage of views.
YouTube reports demographics data for users who are signed in to Google. Because of this, the data you see may not completely reflect all traffic visiting your channel.
- Revenue: Displays a summary of earnings from your channel. It includes these summary reports:
- Main graph: Shows your estimated revenue, estimated monetized playbacks, and playback-based CPM (cost-per thousand impression) for a specified period.
- Monthly estimated revenue: Displays your estimated revenue for the past six months.
- Top earning videos: Shows you which of your videos are generating the most money and how much money they have earned.
- Revenue sources: Provides a breakdown of where your channel revenue is coming from, from sources like advertisements and YouTube Premium.
- Ad types: Shows the types of ads (such as skippable ads, non-skippable ads, bumper ads, and display ads) that are running on your videos, ordered by the percentage of revenue they provide.
The Revenue tab is accessible only to YouTube creators who have been accepted into the YouTube Partner Program.
If you want to see deeper analytics on any summary report described in the preceding list, you can click the See More link at the bottom of the report to open Advanced Mode, which provides access to additional metrics. Similarly, you can launch Advanced Mode by clicking the Advanced Mode link above the Date drop-down menu in the upper right corner of the page at any time to see more granular reporting details.To learn more about the main reporting tabs of YouTube Analytics as well as the summary reports just described, visit https://support.google.com/youtube/answer/9002587.
Breaking down YouTube’s Analytics report components
Beyond the summary reports available within the main pages of YouTube Analytics, YouTube provides a richer set of reporting options within Advanced Mode that may seem overwhelming at first. You quickly discover, however, that navigating this comprehensive reporting module is quite easy because it consists of these four distinct sections:- Filters: Over time, you do a lot different things with your channel, including adding video content, constructing playlists, engaging subscribers, and so much more. You’ll definitely want to set up dynamic filters that are meant to show you only the information associated with each of these aspects of your channel. The Advanced Mode filter section lets you do that.
 Advanced Mode analytics filters.
 - Reports: Advanced Mode reports provide greater detail than the summary reports that are available on the main pages of YouTube Analytics. You can also access some additional reports that aren’t available on the main YouTube Analytics pages and add additional metrics to all reports. You can access this feature from the menu beneath the filters and above the chart within Advanced Mode, or by clicking the See More link at the bottom of any summary report.
- Chart: After you’ve determined which report you want to analyze, you can get lots of information with some fairly flexible graphical representations (charts, in other words) to guide your understanding. This helps you assess the performance of your channel, your content, and your community.
 A YouTube analytics chart.
 - Table: Shows itemized details that correspond to the particular YouTube Analytics report. For example, in the Videos report, you can create a detailed, organized list of your top 50 videos, including name, views, percentage growth in view, estimated minutes watched, and average view duration.
 A YouTube analytics table.


