You can group rows and columns in your Excel pivot table. You might want to group columns or rows when you need to segregate data in a way that isn't explicitly supported by your Excel table.
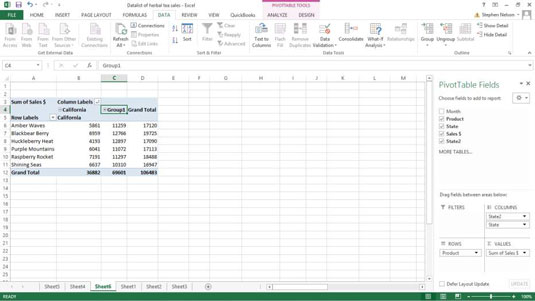
To create a grouping, select the items that you want to group, right-click the pivot table, and then choose Group from the shortcut menu that appears.
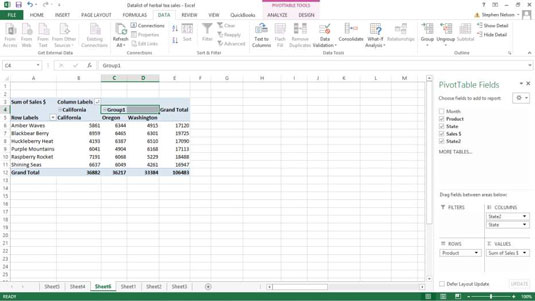
Excel creates a new grouping, which it names in numerical order starting with Group1. Excel still displays detailed individual information about Oregon and Washington in the pivot table. However, the pivot table also groups the Oregon and Washington information into a new category: Group1.
You can rename the group by clicking the cell with the Group1 label and then typing the replacement label.
To ungroup previously grouped data, right-click the cell with the group name (probably Group1 unless you changed it) to again display the shortcut menu and then choose Ungroup. Excel removes the grouping from your pivot table.
Important point: You don't automatically get group subtotals. You get them when you filter the pivot table to show just that group. You also get group subtotals, however, when you collapse the details within a group.
To collapse the detail within a group, right-click the cell labeled with the group name (probably Group1), and choose Expand/Collapse→Collapse from the shortcut menu that appears. To expand a previously collapsed group, right-click the cell with the group name again and choose Expand/Collapse→Expand from the shortcut menu that appears. Or just double-click the group name.