


Compared with other types of hypothesis tests, constructing the test statistic for ANOVA is quite complex. You construct the test statistic (or F-statistic) from the error mean square (MSE) and the treatment mean square (MSTR).
In order to calculate the MSE and MSTR, you first have to calculate the error sum of squares (SSE), treatment sum of squares (SSTR), and total sum of squares (SST), followed by the error mean square (MSE) and treatment mean square (MSTR).
How to find the error mean square
You find the MSE by dividing the SSE by N (total number of observations) minus t (total number of treatments) as shown in this formula:
For example, say a manufacturer randomly chooses a sample of four Electrica batteries, four Readyforever batteries, and four Voltagenow batteries and then tests their lifetimes. This table lists the results (in hundreds of hours).
| Sample | Electrica | Readyforever | Voltagenow |
|---|---|---|---|
| Battery 1 | 2.4 | 1.9 | 2.0 |
| Battery 2 | 1.7 | 2.1 | 2.3 |
| Battery 3 | 3.2 | 1.8 | 2.1 |
| Battery 4 | 1.9 | 1.6 | 2.2 |
In this example, there are a total of 12 observations or elements in the sample data (four batteries chosen from each of three battery types, as shown in the table), so N = 12; because there are three battery types, the number of treatments is t = 3. You are given the SSE to be 1.52.
So plugging these numbers into the MSE formula gives you this:
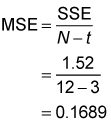
MSE measures the average variation within the treatments; for example, how different the battery means are within the same type.
How to calculate the treatment mean square
The MSTR equals the SSTR divided by the number of treatments, minus 1 (t – 1), which you can write mathematically as:
So you find the MSTR for the battery example, (here, t is the number of battery types) as follows:
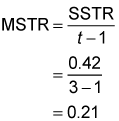
MSTR measures the average variation among the treatment means, such as how different the means of the battery types are from each other.
How to solve for the test statistic (F-statistic)
The test statistic for the ANOVA process follows the F-distribution, and it's often called the F-statistic. The test statistic is computed as follows:
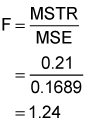
The test statistic shows the ratio of the treatment mean square (MSTR) to the error mean square (MSE). The greater this value, the more unlikely it is that the means of the three batteries are equal to each other. As a result, a sufficiently large value of this test statistic results in the null hypothesis being rejected.
