


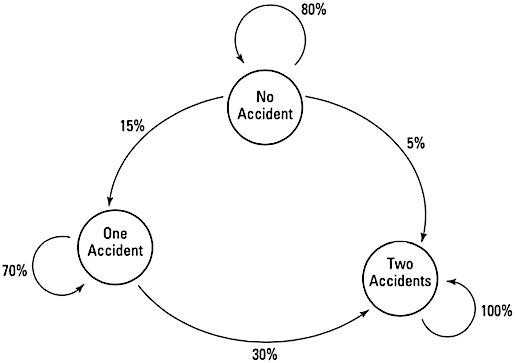
The transition diagram in the following figure shows how an insurance company classifies its drivers: no accidents, one accident, or two or more accidents. This information could help the company determine the insurance premium rates.
 Eighty percent of the no-accident drivers probably won’t have an accident.
You see that 80% of the drivers who haven’t had an accident aren’t expected to have an accident the next year. Fifteen percent of those drivers have one accident, and 5% have two or more accidents. Seventy percent of those who have had one accident aren’t expected to have an accident the next year but have to stay in the one-accident classification. And those in the two-or-more accident class have to stay there.
To create a transition matrix representing the drivers, use the percentages to show going from one state to another.

What is the long-term expectation for these drivers? First, let the transition matrix be D.

Then, some of the powers of D are

At the end of ten years, using the drivers in the initial study, you have

What this tells the insurance company is that, in ten years, about 11% of the original no-accident drivers will still not have had an accident. Only 3% of the one-accident drivers will still have had only that one accident. This situation doesn’t allow for the drivers to move back or earn forgiveness; a one-accident driver can’t be a no-accident driver using this model. Of course, different insurance agencies have different policies, putting drivers in better standing after a set number of accident-free years. And new policyholders are added to make this picture rosier. This just shows the pattern for a particular set of drivers after a certain number of years.


