In statistics, a large sample has a size greater than or equal to 30. When you use a large sample to test a hypothesis about a population mean, the resulting two-tailed critical value or values from the standard normal distribution equal
Because you draw these critical values from the standard normal distribution, you don’t have to calculate degrees of freedom. Unlike the Student’s t-distribution, the standard normal distribution isn’t based on degrees of freedom.
For hypothesis testing applications, the critical values listed in this table are used frequently; you may want to memorize them.
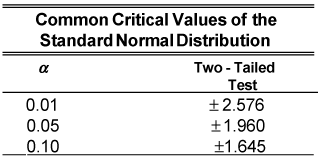
For a two-tailed hypothesis test of the population mean with a level of significance of 0.05, the two critical values are
You can find the positive critical value in a standard normal table, like this one.
| Z | 0.04 | 0.05 | 0.06 | 0.07 |
|---|---|---|---|---|
| 1.5 | 0.9382 | 0.9394 | 0.9406 | 0.9418 |
| 1.6 | 0.9495 | 0.9505 | 0.9515 | 0.9525 |
| 1.7 | 0.9591 | 0.9599 | 0.9608 | 0.9616 |
| 1.8 | 0.9671 | 0.9678 | 0.9686 | 0.9693 |
| 1.9 | 0.9738 | 0.9744 | 0.9750 | 0.9756 |
| 2.0 | 0.9793 | 0.9798 | 0.9803 | 0.9808 |
Keep in mind that finding critical values in a standard normal table is more complicated than finding critical values in a t-table. The body of the standard normal table contains probabilities, unlike in the t-table where the probabilities are contained in the column headings.
In this example, you find the positive critical value
by checking the body of the table for a probability of
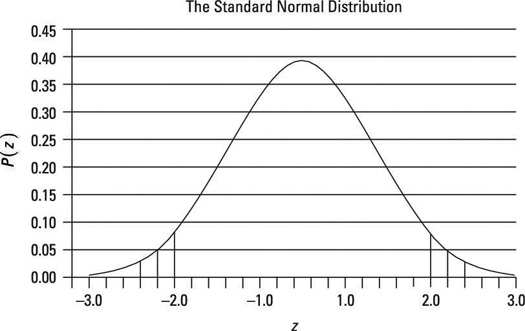
In other words, the positive critical value represents the number of standard deviations above the mean at which
2.5 percent of the area under the standard normal curve is to the right of this point.
97.5 percent of the area under the standard normal curve is to the left of this point.
Because the standard normal table shows areas to the left of specified values, you can find the positive critical value by locating the probability 0.9750, not 0.0250, in the body of the above table. You find this probability by following the row 1.9 under the Z column to the 0.06 column. Therefore, the critical value
The corresponding negative critical value is –1.96. You can write these critical values as
This figure shows these values graphically.