


Logarithms and logarithmic scaling are tools that you want to use in your Excel charts because they enable you to do something very powerful. With logarithmic scaling of your value axis, you can compare the relative change (not the absolute change) in data series values.
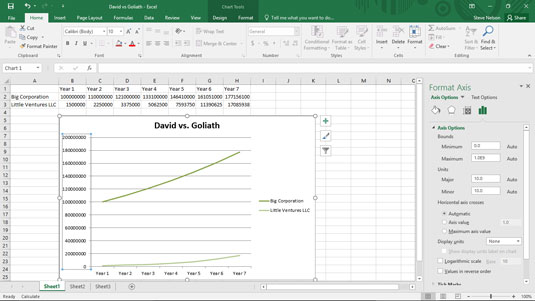
For example, say that you want to compare the sales of a large company that's growing solidly but slowly (10 percent annually) with the sales of a smaller firm that's growing very quickly (50 percent annually). Because a typical line chart compares absolute data values, if you plot the sales for these two firms in the same line chart, you completely miss out on the fact that one firm is growing much more quickly than the other firm.
This figure shows a traditional simple line chart. This line chart doesn't use logarithmic scaling of the value axis.
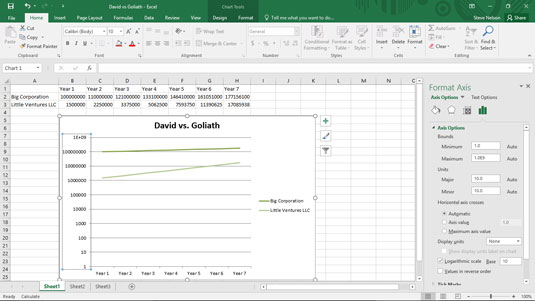
Now, take a look at the line chart shown in the following figure. This is the same information in the same chart type and subtype, but the scaling of the value axis is changed to use logarithmic scaling. With the logarithmic scaling, the growth rates are shown rather than the absolute values. And when you plot the growth rates, the much quicker growth rate of the small company becomes clear. In fact, you can actually extrapolate the growth rate of the two companies and guess how long it will take for the small company to catch up with the big company. (Just extend the lines.)
To tell Excel that you want to use logarithmic scaling of the value access, follow these steps:
Right-click the value (Y) axis and then choose the Format Axis command from the shortcut menu that appears.
When the Format Axis dialog box appears, select the Axis Options entry from the list box.
To tell Excel to use logarithmic scaling of the value (Y) axis, simply select the Logarithmic Scale check box and then click OK.
Excel re-scales the value axis of your chart to use logarithmic scaling. Note that initially Excel uses base 10 logarithmic scaling. But you can change the scaling by entering some other value into the Logarithmic Scale Base box.


