


Values area
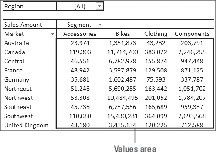
The values area is the large, rectangular area below and to the right of the column and row headings. In the example, the values area contains a sum of the values in the Sales Amount field.
The values area calculates and counts data. The data fields that you drag and drop there are typically those that you want to measure — fields, such as Sum of Revenue, Count of Units, or Average of Price.
Row area
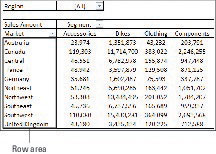
The row area is shown here. Placing a data field into the row area displays the unique values from that field down the rows of the left side of the pivot table. The row area typically has at least one field, although it’s possible to have no fields.
The row area of a pivot table gives you a row-oriented perspective.
The types of data fields that you would drop here include those that you want to group and categorize, such as Products, Names, and Locations.
Column area
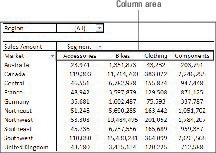
The column area is composed of headings that stretch across the top of columns in the pivot table. The column area of a pivot table gives you a column-oriented perspective.
As you can see, the column area stretches across the top of the columns. In this example, it contains the unique list of business segments.
Placing a data field into the column area displays the unique values from that field in a column-oriented perspective. The column area is ideal for creating a data matrix or showing trends over time.
Filter area

The filter area is an optional set of one or more drop-down lists at the top of the pivot table. Here, the filter area contains the Region field, and the pivot table is set to show all regions. The filter area allows you to easily apply filters to the pivot table report.
Placing data fields into the filter area allows you to filter the entire pivot table based on your selections. The types of data fields that you might drop here include those that you want to isolate and focus on; for example, Region, Line of Business, and Employees.


