


To estimate a time series with regression analysis, the first step is to identify the type of trend (if any) that's present in the data. The type of trend, such as linear or quadratic, determines the exact equation that is estimated.
No trend
In the case where a time series doesn't increase or decrease over time, it may instead randomly fluctuate around a constant value. In this case, the time series has no trend. The trend equation is set equal to a constant, which is the intercept of a regression equation:
The corresponding regression equation is
When no trend occurs, the values of the time series may rise or fall, but on average they tend to return to the same level
This figure shows a time series with no trend.
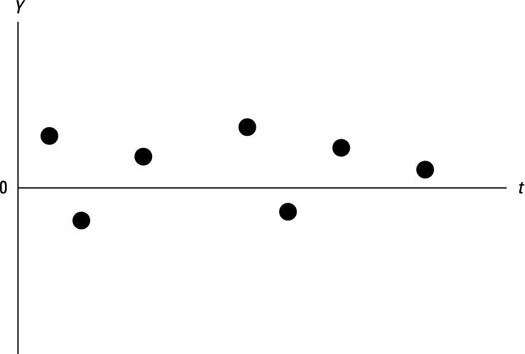
Notice that the values of Y are randomly rising and falling; there is no clear pattern in the data.
Linear trend
With a linear trend, the values of a time series tend to rise or fall at a constant rate
The linear trend is expressed as
The corresponding regression equation is
The following figure shows a time series with a positive linear trend. With this type of trend, the independent variable yt increases at a constant rate over time. (If a time series has a negative linear trend, the independent variable yt decreases at a constant rate over time.)
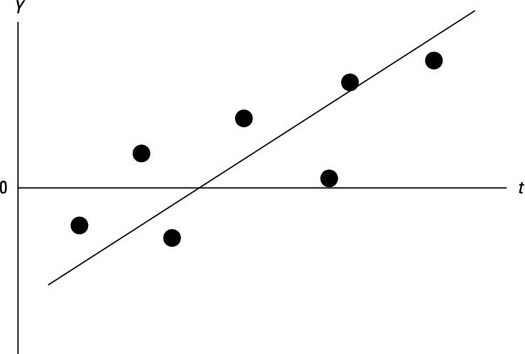
Note that as t increases (such as time elapses), Y tends to increase on average. The trend line drawn through the values of Y has a positive slope, indicating that Y has a positive linear trend.
Quadratic trend
With a quadratic trend, the values of a time series tend to rise or fall at a rate that is not constant; it changes over time. As a result, the trend is not a straight line. The trend is expressed as
The corresponding regression equation is
The following figure shows a time series with a quadratic trend. In this case, the value of yt increases at an increasing rate over time.
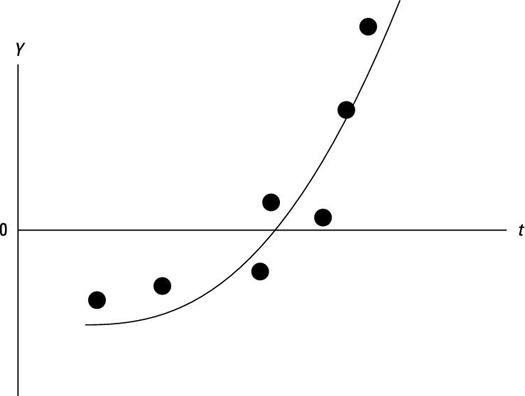
Note that as t increases (such as time elapses), Y tends to increase at an increasing rate. The trend is curving upward; this type of curve indicates that the Y has a positive quadratic trend.
A quadratic equation has at least one squared term. For example, the following is a quadratic equation:
Other possible trends
It's possible that a trend may contain terms that are raised to the third power, fourth power, or higher. This type of trend is extremely rare in business applications. Most time series of financial data have a linear trend, a quadratic trend, or no trend at all.


