


When you're testing hypotheses about two population means, where the variances of the two populations aren't equal, and the size of both samples are large (30 or greater), the appropriate test statistic is
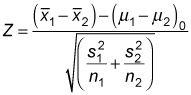
This test statistic is based on the standard normal distribution.
As an example, say that a restaurant chain is interested in finding out whether the average sale per customer is the same in its domestic and foreign restaurants. The population variances are assumed to be unequal. The restaurant chooses a random sample of 40 domestic and 50 foreign restaurants, designating domestic restaurants as population 1 and foreign restaurants as population 2.
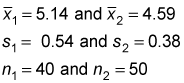
The sample mean spending per customer is $5.14 in the domestic market and $4.59 in the foreign market. The sample standard deviation is $0.54 in the domestic market and $0.38 in the foreign market. The null hypothesis that the population mean spending is equal in the two markets is tested at the 5 percent level of significance.
Here's a summary of this data:
The null hypothesis is
Because this example requires a two-tailed test, the alternative hypothesis is
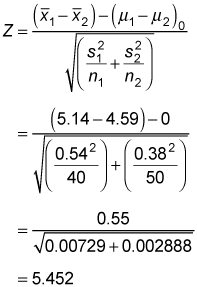
You find the test statistic like so:
Now you use the standard normal table to find the critical values.
| Z | 0.04 | 0.05 | 0.06 | 0.07 |
|---|---|---|---|---|
| 1.5 | 0.9382 | 0.9394 | 0.9406 | 0.9418 |
| 1.6 | 0.9495 | 0.9505 | 0.9515 | 0.9525 |
| 1.7 | 0.9591 | 0.9599 | 0.9608 | 0.9616 |
| 1.8 | 0.9671 | 0.9678 | 0.9686 | 0.9693 |
| 1.9 | 0.9738 | 0.9744 | 0.9750 | 0.9756 |
| 2.0 | 0.9793 | 0.9798 | 0.9803 | 0.9808 |
From the table, you find the critical values to be
Because the test statistic (5.452) is greater than the positive critical value (1.96), the null hypothesis
is rejected.
Because this is a two-tailed test, you may reject the null hypothesis in favor of the alternative
(that is, mean spending per customer is greater in the domestic market than the foreign market) or
(that is, mean spending per customer is lower in the domestic market than the foreign market.) Because the test statistic is large and positive, the alternative
is chosen. In other words, mean spending per customer in the domestic market is greater than in the foreign market.


