


POISSON.DIST:
- Select a cell for
POISSON.DIST’s answer. - From the Statistical Functions menu, select
POISSON.DISTto open its Function Arguments dialog box. - In the Function Arguments dialog box, enter the appropriate values for the arguments.
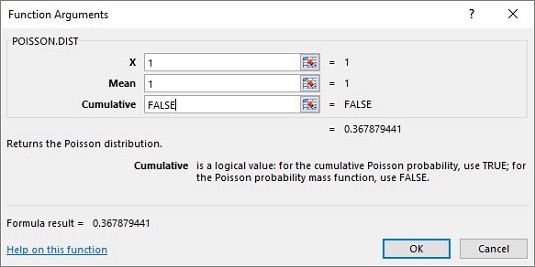
In the X box, enter the number of events for which you’re determining the probability. For this example, you’re looking for pr(1), so enter 1.
In the Mean box, enter the mean of the process, which for this example is 1.
In the Cumulative box, it’s either
TRUEfor the cumulative probability orFALSEfor just the probability of the number of events. EnterFALSE. With the entries for X, Mean, and Cumulative, the answer appears in the dialog box. The answer for this example is .367879441. - Click OK to put the answer into the selected cell.
In the example, you see the probability for two defective joints in 1,000 and the probability for three. To follow through with the calculations, type 2 into the X box to calculate pr(2), and 3 to find pr(3).
In the 21st century it’s pretty easy to calculate the binomial probabilities directly. The image below shows you the Poisson and the binomial probabilities for the numbers in column B and the conditions of the example. The probabilities are graphed so you can see how close the two really are. Cell D3 was selected, so the Formula bar shows you how BINOM.DIST was used to calculate the binomial probabilities.

Although the Poisson’s usefulness as an approximation is outdated, it has taken on a life of its own. Phenomena as widely disparate as reaction time data in psychology experiments, degeneration of radioactive substances, and scores in professional hockey games seem to fit Poisson distributions. This is why business analysts and scientific researchers like to base models on this distribution.
