


Several other kinds of means, besides arithmetic, are useful measures of central tendency in certain circumstances. They're called means because they all involve the same "add them up and divide by how many" process as the arithmetic mean, but each one introduces a slightly different twist to the basic process.
Inner mean
The inner mean (also called the trimmed mean) of N numbers is calculated by removing the lowest value and the highest value and calculating the arithmetic mean of the remaining N – 2 "inner" values. For the IQ example (84, 84, 89, 91, 110, 114, and 116), you would drop one of the lowest values (an 84) and the highest value (116), and calculate the inner mean as (84 + 89 + 91 + 110 + 114)/5 = 488/5 = 97.6.
An even "inner-er" mean can be calculated by dropping the two (or more) highest and two (or more) lowest values from the data and then calculating the arithmetic mean of the remaining values. In the interest of fairness, you should always chop the same number of values from the low end as from the high end.
Like the median, the inner mean is more resistant to outliers than the arithmetic mean. And, if you think about it, if you chop off enough numbers from both ends of the sorted set of values, you'll eventually be left with only the middle one or two values — this "inner-est" mean would actually be the median!
Geometric mean
The geometric mean (often abbreviated GM) can be defined by two different-looking formulas that produce exactly the same value. The basic definition has this formula:
This formula is telling you to multiply the values of the N observations together (that's what Π, the "capital Pi" symbol, indicates), and then take the Nth root of the product. The IQ example (84, 84, 89, 91, 110, 114, and 116) looks like this:
This formula can be difficult to evaluate; even computers can run into trouble with the very large product that might be generated when calculating the GM of a lot of numbers. By using logarithms (which turn multiplications into additions and roots into divisions), you get a "numerically stable" alternative formula:
This formula may look complicated, but it really just says, "The geometric mean is the antilog of the arithmetic mean of the logs of the numbers." You take the log of each number, average all those logs the usual way, and then take the antilog of the average. You can use natural or common logarithms; just be sure to use the same type of antilog.
The geometric mean is often used when summarizing skewed data, especially if there is reason to believe that the data might be log-normally distributed, because the logarithms of log-normally distributed values are normally distributed.
Root-mean-square
The root-mean-square (RMS) of a bunch of numbers is defined this way:
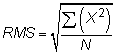
You square each number, average all those squares the usual way, and then take the square root of the average. For example, the RMS of the two numbers 10 and 20 is
The RMS is useful for summarizing the size of random fluctuations. In fact, the standard deviation of a set of numbers is calculated by a method that is nearly identical to calculating the RMS of the deviations of each value from the mean of those values.
