


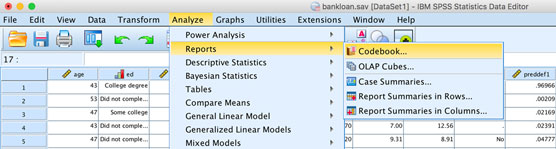
 SPSS Statistics Analyze menu
SPSS statistics variables level of measurement
Level of measurement defines which summary statistics and graphs should be used. The following table provides definitions, examples, appropriate summary statistics, and graphs for variables based on their level of measurement.
| Nominal | Ordinal | Scale | |
|---|---|---|---|
| Definition | Unordered categories | Ordered categories | Both interval and ratio |
| Examples | Gender, geographic location, job category | Satisfaction ratings, income groups, ranking of preferences |
Number of purchases, cholesterol level, age |
| Measures of Central Tendency | Mode | Median | Median or mean |
| Measures of Dispersion | None | Min/max/range | Min/max/range, Standard deviation/ variance |
| Graph | Pie or bar | Bar | Histogram |
SPSS statistics chart to show relationships between a pair of variables
When choosing a graph, you need to know the level of measurement of the variables. The following table shows some of the graphs that can be used to display relationships between different types of variables.
| Categorical Dependent | Scale Dependent | |
|---|---|---|
| Categorical Independent | Clustered bar or paneled pie | Error bar or boxplot |
| Scale Independent | Error bar or boxplot | Scatter plot |
SPSS statistics commonly used analyze menus
The following table provides a list of some of the most commonly used procedures in the Analyze menu in SPSS Statistics.
| Menu | Submenu | Useful For |
| Code Book | Reports | Provides a quick look at all your variables at once. The level of measurement automatically controls which summary statistics are displayed. |
| Frequencies | Descriptives | Tells you how many of each category value you have. Most useful for categorical variables because you can run all of them at once. |
| Descriptives | Descriptives | Gets basic scale variable information, such as the mean and standard deviation. |
| Explore | Descriptives | Based on a famous book, Exploratory Data Analysis, looks at all kinds of variables as well as pairs of variables. |
| Crosstabs | Descriptives | Tests to see if categorical variables are independent of each other or related to each other. |
| Means | Compare Means | Calculates subgroup means and related statistics for dependent variables within categories of one or more independent variables. |
| One-Sample T-Test | Compare Means | Tests whether the mean of a single variable differs from a specified value (for example, a group using a new learning method compared to the school average). |
| Independent Samples T-Test | Compare Means | Tests whether the means for two groups differ on a continuous dependent variable (for example, females versus males on income). |
| Paired Samples T-Test | Compare Means | Tests whether a significant difference exists in the mean under two conditions (for example, before versus after, or standing versus sitting). |
| One-Way ANOVA | Compare Means | Tests whether the means for two or more groups differ on a continuous dependent variable (for example, drug1 versus drug2 versus drug3 on depression). |
| Bivariate Correlation | Correlate | Determines the similarity in the way two continuous variables change in value from one case (row) to another through the data. |
| Linear Regression | Regression | Predicts a continuous dependent variable from one or more continuous independent variables |
| One Sample | Nonparametric Tests | Compares the distribution of a categorical dependent variable to population norms. |
| Independent Samples | Nonparametric Tests | Tests whether the means or medians for two or more different groups differ on a dependent variable. |
| Related Samples | Nonparametric Tests | Tests whether the means or medians of the same group differ under two conditions or time points. |
| Univariate | General Linear Model | An extension of one-way ANOVA in which there is more than one independent variable. |
| Multivariate | General Linear Model | An extension of one-way ANOVA in which there is more than one dependent variable. |
| Repeated Measures | General Linear Model | An extension of the paired-samples t-test in which the same group is assessed under two or more conditions or time points. |
| Binary Logistic | Regression | Used in situations similar to linear regression but the dependent variable is dichotomous. |
| Multinomial Logistic | Regression | An extension of binary logistic regression in which the dependent variable is not restricted to two categories. |
| Discriminant | Classify | Builds a predictive model for group membership based on the linear combinations of predictors that best separate the groups. |
Interpreting statistical significance in SPSS statistics
When conducting a statistical test, too often people jump to the conclusion that a finding “is statistically significant” or “is not statistically significant.” Although that is literally true, it doesn’t imply that only two conclusions can be drawn about a finding.
What if in the real world no relationship exists between the variables, but the test found that there was a significant relationship? In this case, you would be making a false positive error because you falsely concluded a positive result (you thought it does occur when in fact it does not).
On the other hand, what if in the real world a relationship does exist between the variables, but the test found that there was no significant relationship? In this case, you would be making a false negative error, because you falsely concluded a negative result (you thought it does not occur when in fact it does).
| In the Real World | Statistical Test Results | |
|---|---|---|
| Not Significant (p > 0.5) | Significant (p < 0.5) | |
| The two groups are not different | The null hypothesis appears true, so you conclude the groups are not significantly different. |
False positive. |
| The two groups are different | False negative. | The null hypothesis appears false, so you conclude that the groups are significantly different. |


