


Some of these 10 gotchas can be confusing at first. Others are straightforward, but new users might not attribute to them the importance they deserve. What they all have in common is that ignorance of them can get you into hot water. Whenever something seems to be amiss in SPSS, double-check this list. To earn its way onto this list, these gotchas must have generated hundreds of real-world problems as witnessed by us in our client interactions.
Failing to declare level of measurement
To many new users of SPSS, declaring Level of Measurement seems like a nuisance. You can safely ignore it for a while, but our advice is to not wait until the day that it starts causing problems. Here are just a few noteworthy situations where you will regret a decision to procrastinate getting your datasets set up properly:- A variable that you need might not appear in a dialog.
- Features that rely on metadata, such as Codebook, will produce poor results.
- The chart dialogs won’t offer you the options you need for a particular variable.
- The Custom Tables add-on module will behave strangely.
Conflating string values with labels
Avoid using the string variable type. Instead, use a combination of values and value labels. Back in the 60s and 70s, RAM and hard drive space were expensive and limited. Strings use many more characters and bytes than numerics, and back then SPSS couldn’t perform calculations using RAM alone, so it needed to use the hard drive as we might use a scratch pad. Now, it might seem quaint to worry about such things, but avoiding strings is still core to the design philosophy of SPSS.So what kinds of variables should be stored as strings? Addresses, open-ended comments in survey data, and the names of people and companies are good examples of string variables. There aren’t many more. The names of the 50 states, the names of products, product categories and SKUs, and most other nominal variables should be set up as pairs of values and value labels.
In the past, leading zeros in data such as zip codes posed a problem, so the data would be declared as string. Now, however, the restricted numeric variable type adds leading zeros padded to the maximum width of the variable, so a zip code variable no longer needs to be declared as a string. Also, Autorecode makes conversions from string to numeric easy. Keep string variables to a minimum.
Excel files do not allow for metadata, so Excel does not support value and value label pairs. When frequently importing string data from Excel, consider learning the syntax commands as well as autorecode transformation because these techniques might be helpful.
Failing to declare missing data
Years ago, an SPSS user in one of our classes experienced the following situation. He had a 1 through 10 scale, with 10 as the highest satisfaction rating and 1 as the lowest satisfaction rating. He needed a code to represent “refused to answer” and chose 11. When he learned about missing data in class, he wondered if just leaving the 11s in the data would be okay because he had already completed the analysis and the number of refusals was fairly low.You bet it caused a big problem! It could move the average satisfaction quite far towards 11 even with a 1 to 2 percent non-response. What was striking about this example was that the most common answer, 1, was very far from the coded-value for non-response. That fact should have made the analysis obviously wrong and easy to spot. Worse, it is well understood in survey research that refusals often reflect respondents who are highly dissatisfied but reluctant to share their opinion. The choice of 11 made their opinion look highly satisfied, not highly dissatisfied, distorting the results even more.
Sadly, folks forget to declare missing quite often, and the error often persists through the final steps of the analysis and is never uncovered. In the example, the problem could have been fixed with one simple step: Declare 11 as user-defined missing. Be vigilant about declaring missing data values in your metadata.
Failing to find add-on modules and plug-ins
What can go wrong with add-on modules? The problem that we observe often with clients is that they read about features in add-on modules and then can’t find the modules. This might seem odd. Wouldn't everyone know which SPSS functions they own? But you, too, could be confused for several reasons:- Someone else paid for your copy of SPSS, often a copy that you access at school or work
- The paperwork for your copy of SPSS says Standard or Premium, but it's not clear what this means.
- You try to find the module in the menus, referring to an image in a book or blog post, and your screen doesn't look like the image.
- You borrow some working SPSS syntax from a colleague or book, but it fails to work on your copy of SPSS.
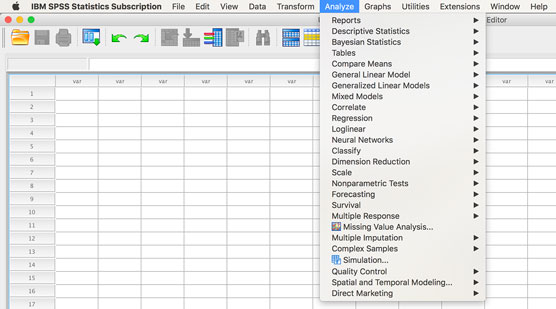 The Analyze menu with all modules available.
Nothing is wrong with your copy of SPSS. You just don’t have access to all features, including via SPSS Syntax. Some believe that if you know the necessary code and bypass the graphical user interface, you can run any command, but that is not true. To run the syntax for an add-on module, you must own the module. We stress this point because we have seen people borrow Syntax from a source, colleague, or book, and try to copy and paste the code into the Syntax window. The syntax code will not work if you lack the proper licensing.
Another common source of confusion is that many SPSS users don't realize that they have access to add-on modules at work or school. This is unfortunate because the modules can be extremely useful. We always recommend the Custom Tables module to clients for greater efficiency in their analysis. Countless times, clients have thought that they had no modules only to discover that Custom Tables was visible in the menus and functioning.

Finally, “plug-ins” are a little different than add-on modules. Features can be added to SPSS by using Python and R. If you're a programmer, you could consider doing this task yourself. However, many of these extensions are already available. All you have to do is download them, and they will appear as additional menu items, with a plus symbol next to the menu entry (see the margin icon). Retired SPSSer Jon Peck was instrumental in adding this programmability feature to SPSS.
Failing to meet statistical and software assumptions
SPSS is not that smart. SPSS will do whatever you ask it to do. So, if you have a variable like Marital Status, with the values: 1= Married, 2=Divorced, 3=Separated, 4=Widowed, and 5=Single, and you ask SPSS to give you a mean for Marital Status, SPSS will give you a mean. However, a mean of 2.33 for a nominal variable like Marital Status is not useful. Similarly, if you analyze your data and find that 100% of your friends that you surveyed think that more monetary resources should be devoted to the tennis center at your country club, but you only interviewed tennis players, then you cannot pass off your results as a random sample of country club members, nor can you be surprised with your findings.It is important that you have reliable and valid data. SPSS assumes that your data comes from a random sample; if this is not the case, you can still obtain descriptive information, however you will not be able to generalize your results to a population. You will also need to know what information you can glean from your data.
Additionally, it is important to remember that every statistical test has assumptions. Some statistical tests in SPSS, like the independent samples t-test, automatically assess some of the test assumptions, however most of the time; you will have to run additional checks to assess test assumptions. Remember that the better you meet test assumptions, the more you can trust the results of a test.
You may hear that a test is sensitive to violations of assumptions or robust to violations of assumptions. When a test is sensitive, you have to be especially careful to meet the assumptions. When a test is robust, there is more wiggle room with the assumptions.
Confusing fasting syntax with copy and paste
Virtually all SPSS users start by learning SPSS via the Graphical User Interface and many find SPSS Syntax to be a bit arcane. The confusion arises when a colleague shares a bit of syntax code and offers it up as a shortcut, but it can all look very intimidating. The fear is that you will have to have a big book open on your desk and that you will be typing the commands letter by letter. This is simply not true.Even if a well-meaning colleague exclaims “It’s easy, just paste it,” it might not be clear what they mean. “Pasting” in SPSS, in regards to SPSS Syntax, means to let the SPSS dialogs generate the syntax code for you by giving the instructions via point and click. The syntax is then generated and sent to the Syntax Window. You can think of it as converting clicks into code. It is not the copy, paste maneuver (Control-C, Control-V in Windows) that we do in most software.
Thinking you create variables in SPSS as you Do in Excel
Almost everyone who learns SPSS brings prior exposure to Excel to the learning experience. There is a critical function in both which is handled quite differently in the two interfaces. In Excel, when you want to implement a formula you work directly in a cell of the spreadsheet and the formula is saved in that same location when you save the spreadsheet. In SPSS, you must use the Compute Variable dialog (or the equivalent in SPSS Syntax) and your formula is not saved in the dataset @@md only the result is saved in the dataset.At first, it might seem highly desirable for everyone to save formulas in the dataset, but it might not be clear the high price that is paid for this feature in Excel. SPSS is built to be scalable to large datasets, sometimes 100s of millions of rows of data. In Excel, the spreadsheet must be constantly scanned to update the values of formulas. That scanning, passively and automatically in the background, consumes resources and makes Excel less scalable to very large datasets. Excel becomes noticeably sluggish when datasets are very large for this reason, but Excel was never designed for huge datasets. In SPSS, the data remains constant unless an action prompts a change. To force calculations to update, either the menus must be used again or SPSS Syntax must be run again. Each system is designed with its primary audience in mind.
If you are more familiar with how Excel automatically updates calculations, how should you acclimate to SPSS? If most of your data is read in from a file and you proceed directly to analysis then you will probably be quite content using the Graphical User Interface. If you have very large files or if you have a large number of calculations that are made after the data is read in from a file, you will need to learn SPSS Syntax to be productive. By saving those calculations, perhaps dozens or hundreds of them, in the form of SPSS Syntax you can rerun them all quite easily.
Excel currently has a limit of 1,000,000 rows of data, but just a few years ago the limit was much smaller. This is rarely an issue for Excel users as that many rows is usually sufficient. Excel experts can often find a way around this limit, but it is rarely necessary. The technical reason for this limit is that the entire spreadsheet must be accessible to a computer’s memory. SPSS does not require the entire dataset to fit in the computer’s memory. This is important to many SPSS users because thousands of companies with datasets larger than the million-row limit need to analyze their large datasets in SPSS. The IRS is a notable example of an organization that uses SPSS that has datasets much larger than the million-row limit.
Getting confused by listwise deletion
Missing data has often been treated as a chapter-length (or even book-length) topic, but a discussion of that length is not possible in this article. You can handle missing data in many ways, one of which is to use listwise deletion. And being familiar with the term listwise deletion may alert you to what would otherwise seem like strange behavior in SPSS. Imagine that you have a large dataset, with thousands of rows. But when you run a multivariate analysis, SPSS behaves as if you have no data at all. You check the steps multiple times, but all you see in the results are messages that indicate that you have “no valid cases.” What could be happening?Listwise deletion is one method for determining which cases in the dataset are used by SPSS for multivariate analysis. When this method is applied, only cases that are valid for all variables in the analysis are used. Missing just a single cell of information in the case row will cause the entire case to be removed. Why is this common? Imagine that you're collating data on airline passengers. One column records if a passenger chose to purchase an inflight meal, which applies to only coach passengers. Another column records which of two meal choices the person chose during the first-class meal, which applies to only first class passengers. Every row in the dataset will be missing one or the other, resulting in zero rows of data being presented to the multivariate analysis. This situation is common.
This short discussion is not sufficient to weigh the pros and cons of using listwise deletion. However, you will now be aware of it when you run into the problem of zero cases being analyzed. Also be on the lookout for times when many fewer cases than you were expecting are analyzed. In the Options dialog of the Linear Regression dialog, listwise deletion is the default. Be careful not to haphazardly choose among the other choices until the regression works. Instead, understand the other options before you try them.
Losing track of your active dataset
Your SPSS skills are progressing along nicely and you decide that it's time to try SPSS Syntax. You double-check your work, run the syntax, and encounter the warning shown here. You confirm that you have the necessary dataset and the necessary variable. What has happened?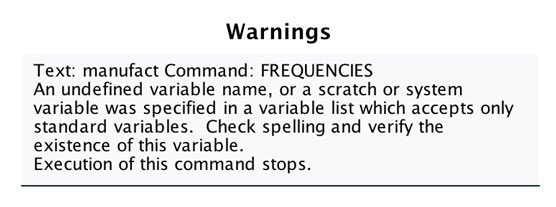 Warning: Necessary variables are missing.
Almost certainly, you have two (or more) datasets open and you’ve lost track of which one is active. When you're working in the graphical user interface, it's virtually impossible to get confused because when you access the menus and dialogs you're generally doing so from the Data Editor window. When you're using SPSS Syntax, however, you're running code and there's no guarantee that the necessary data elements are present. Here's what you need to do: Check to see if you have more than one dataset open, and ensure that the dataset you need is the active dataset. The Syntax window has the following indicator:
![]()
DataSet1 is simply the dataset you opened first. To switch to DataSet2, simply click the arrows and select it. You can assign the dataset that you need also by using the following bit of syntax: DATASET ACTIVATE DataSet1.
Forgetting to turn off Select and Split and Weight
A common mistake occurs when you're dealing with a command that stays in effect until you explicitly instruct SPSS to turn it off. Three of these commands are Select, Split, and Weight, which are somewhat unusual in SPSS because they're typically associated with a temporary adjustment to an analysis, not with a permanent change to the data. Weight is more technical and is more often associated with survey analysis. Here is a quick explanation of each:- Select: Indicates which cases you want to include or exclude from your analysis
- Split: Separates the dataset by a grouping variable and analyzes each group separately
- Weight: Adjusts underrepresented groups as if they were fully represented, and applies the reverse adjustment to overrepresented groups.
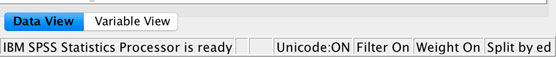 The Filter, Weigh, and Split indicators.
If SPSS is behaving strangely and you're not getting the results you expect, check these indicators. To turn an indicator off, return to the dialog where you gave the original instruction.
A common mistake is to accidentally use Select and Split at the same time. (Power users of SPSS might do this intentionally, but only rarely.) In particular, it's never a good idea to use Select and Split on the same variable at the same time. If you do, numerous warnings will appear in the SPSS Output Viewer window.


