


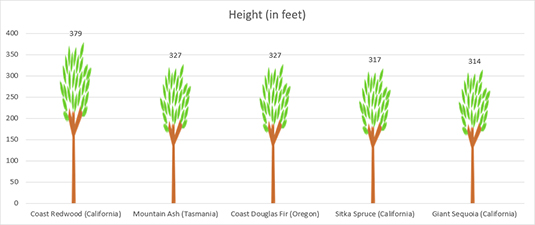
Rather than bars, you can use images to represent data in an Office 2016 chart. In this bar chart, tree images serve in place of bars to compare the height of different trees.
Follow these steps to use images in place of bars in a bar chart:
Create a bar chart.
Copy a suitable image for the bars in your chart to the Clipboard. The easiest way to do this is to go to the Insert tab, click the Online Pictures button, search for and select a picture in the Insert Pictures dialog box, and click the Insert button. After the picture arrives, right-click it and choose Copy to copy it to the Clipboard.

Click a bar in your chart to select it. Selecting one bar selects all the bars in the chart. (If you have trouble selecting the bars, go to the (Chart Tools) Format tab, open the Chart Elements drop-down menu located in the upper-left corner of the screen, and choose a Series on the menu.)
On the (Chart Tools) Format tab, click the Format Selection button (it's located in the upper-left corner of the screen). The Format Data Series task pane opens.
Click the File & Line button to display Fill options.

Select the Picture or Texture Fill option button. Insert Picture from Options appear in the task pane.
Click the Clipboard button.


