
In a two-good model, the budget line is a simple straight line whose slope is the ratio of prices. But if, for instance, a tax changes the cost of a good relative to others, that is tantamount to a price change, and you can use the shape of the budget line to think about how to analyze the effect of the tax.
Before doing so, you have to be a bit more specific about the type of tax, because different taxes do different things to the shape of the budget line.
You want to distinguish two types of tax (or their seemingly positive cousin, subsidies) that affect the constraint:
Quantity taxes: A tax per unit of something bought. Examples are the tax that government levies on gasoline, expressed per gallon, or the "sin" taxes levied on certain goods, such alcohol and cigarettes per unit. These taxes, also called excise taxes, simply change the price paid for that quantity: If x1 is the quantity of unleaded gasoline, and the quantity tax is τ per unit, the price of a gallon is p1 + t, and you can treat the imposition of the tax as a price change.
Ad valorem ("to the value of") taxes: Instead of being levied on a per unit quantity of the good, an ad valorem tax is levied as a percentage of the purchase price of the good. A common example is the sales tax.
In the U.S., the sales tax varies according to jurisdictions within the country. For example, the sales tax in Chicago is 10.25% — consisting of 6.25% state, 1.25% city, 1.75% county, and 1% for the regional transportation authority. In Baton Rouge, Louisiana, the sales tax is 9%, consisting of 4% state and 5% local rate.
If the pre-tax price of the good is p1, then the post-tax price is (1 + t) p1 where τ is the ad valorem rate of tax. For the 10.25% sales tax that a consumer pays in Chicago, t equals 0.1075 (convert the percentage to a decimal), and 1 + t is 1.1075. So the price of a good is 1.1075 times p.
Again, you can treat the introduction of an ad valorem tax as being tantamount to an increase in the price of the good you're considering and manipulate the budget constraint to show it. In this case, the constraint would show the bundles of goods that can be consumed when the sale tax on good 1 is included in the post-tax price.
An interesting case to consider is what happens when a tax is only levied on consumption of a good above a certain price. In Massachusetts, the sales tax of 6.25% is not levied on clothing that costs less than $175. Any individual clothing item that is more than $175 is taxable on the amount over the basic exemption. If you buy a $200 coat, $1.56 or 6.25% of the $25 taxable amount would be added to the price. So, the microeconomics question is: How do you look at this aspect using a budget constraint?
The answer's easy: One slope of the line for purchases goes up to the threshold and then the line bends at that point (see the following figure).
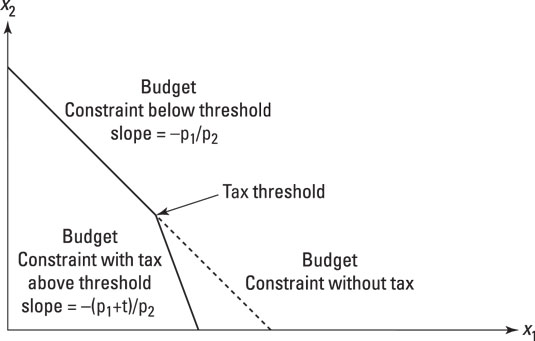
To make everything easier, think about the tax being levied on a quantity rather than a value tax. Suppose, for argument's sake, that the first item of clothing does not incur a tax, but the second does. Now, while you're deciding to buy a first item, the budget constraint is the constraint for x1 up to the point where x1 = 1. Here, the slope of the budget constraint is –p1/p2 as it was earlier. However, beyond x1 = 1, the slope changes to become –(p1 + t)/p2. As you can see, the budget line is steeper beyond the threshold.
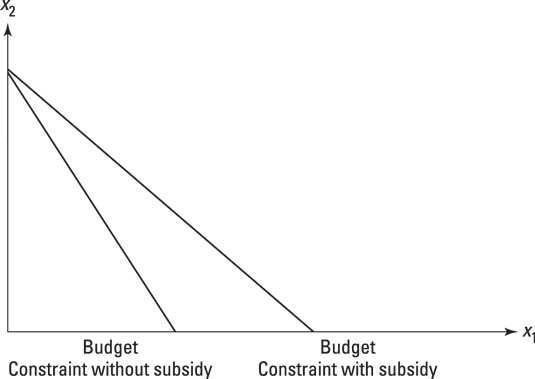
You can do the same type of graphing with subsidies, too. A subsidy, in this case, is just a negative tax, and so instead of adding it to the price you subtract it. Therefore, if good x1 is subsidized, the budget slope is –(p1 – t)/p2.
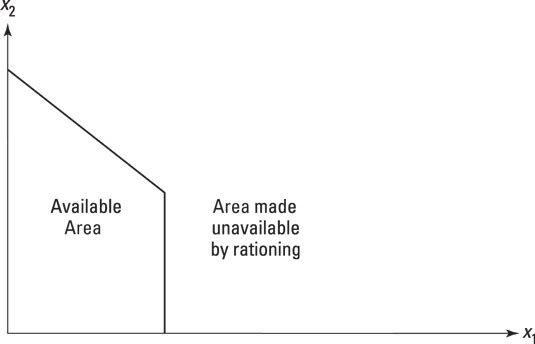
Rationing also affects the budget line. If a good is rationed, one area of the budget set becomes unavailable at any price — the set is said to be truncated in economics-speak.
To show this, cut a vertical line in above the maximum rationed consumption of good x1. To the left of the line, the budget set behaves as normal. To the right, where the maximum consumption is greater than the rationed amount — call it R for the moment — the set consists of goods that the consumer could afford, but can't get.