


The standard deviation (usually abbreviated SD, sd, or just s) of a bunch of numbers tells you how much the individual numbers tend to differ (in either direction) from the mean. It's calculated as follows:

This formula is saying that you calculate the standard deviation of a set of N numbers (Xi) by subtracting the mean from each value to get the deviation (di) of each value from the mean, squaring each of these deviations, adding up the
terms, dividing by N – 1, and then taking the square root.
This is almost identical to the formula for the root-mean-square deviation of the points from the mean, except that it has N – 1 in the denominator instead of N. This difference occurs because the sample mean is used as an approximation of the true population mean (which you don't know). If the true mean were available to use, the denominator would be N.
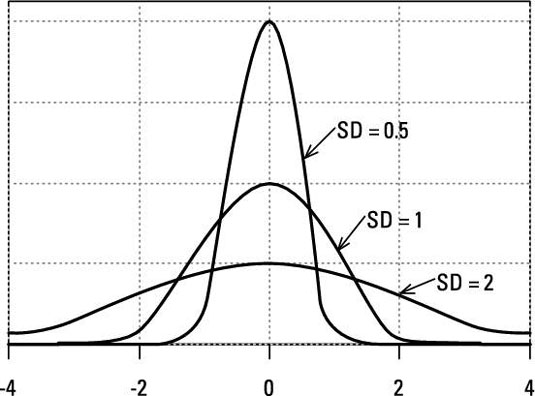
When talking about population distributions, the SD describes the width of the distribution curve. The figure shows three normal distributions. They all have a mean of zero, but they have different standard deviations and, therefore, different widths. Each distribution curve has a total area of exactly 1.0, so the peak height is smaller when the SD is larger.
For an IQ example (84, 84, 89, 91, 110, 114, and 116) where the mean is 98.3, you calculate the SD as follows:
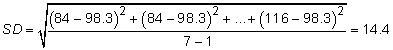
Standard deviations are very sensitive to extreme values (outliers) in the data. For example, if the highest value in the IQ dataset had been 150 instead of 116, the SD would have gone up from 14.4 to 23.9.
Several other useful measures of dispersion are related to the SD:
Variance: The variance is just the square of the SD. For the IQ example, the variance = 14.42 = 207.36.
Coefficient of variation: The coefficient of variation (CV) is the SD divided by the mean. For the IQ example, CV = 14.4/98.3 = 0.1465, or 14.65 percent.


