


In Excel 2010, data tables display the chart values in a grid beneath the chart. They are helpful if you need to see exact values along with a graphical display, such as when using a 3-D chart. Also, they may be preferable to data labels, which can be difficult to read within some charts.
Click anywhere on the chart you want to add a data table to.
Data tables can be added to charts on a regular worksheet, but it isn’t a common practice because the worksheet itself already displays the data.
On the Chart Tools Layout tab, click the Data Table button in the Labels group.
Options include None (to remove a data table), Show Data Table, and Show Data Table with Legend Keys.
Make a selection from the Data Table menu.
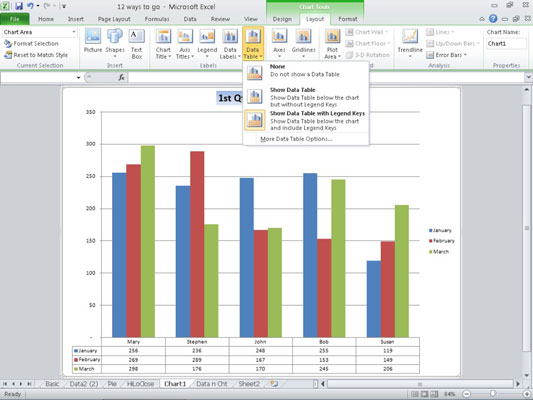
You can select More Data Table Options to see additional formatting options for data tables.
Click OK.
A data table showing the actual values appears at the bottom of the chart.
