


In the investment banking world, the evening news typically reports how the Dow Jones Industrials or S&P 500 stock indexes performed that day, but results in the bond market generally aren't reported by the popular media. There isn't the equivalent of a widely followed bond market index to the two popular equity indexes.
So, bond investors typically consider the U.S. Treasury yield curve the appropriate bond market benchmark and monitor changes to the yield curve to gauge the bond market and interest rates.
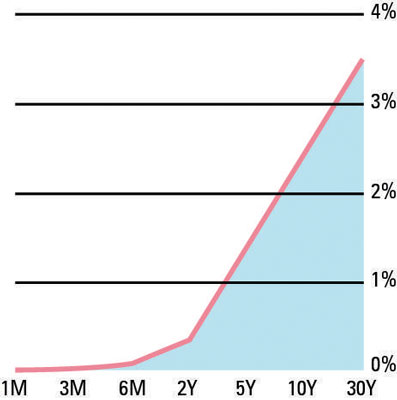
The U.S. Treasury yield curve is simply a graph showing the relationship between yield on a U.S. Treasury security in relation to the maturity of the instrument. U.S. Treasury securities are used because they're always issued by the same entity — the U.S. Treasury — and they have no default risk. So, they give an idea of what investors demand for the pure time value of money.
Most often, the yield curve is upward sloping. In other words, longer-maturity (longer-duration) Treasury bonds have a higher yield to maturity than shorter-maturity Treasury bonds. This makes intuitive sense: A longer time period generally has greater risks, just because there's more time for unexpected things to happen.
Most lenders prefer to lend short term, and most borrowers prefer to borrow long term. To induce lenders to lend long term, lenders must be offered a time premium.
Sometimes, however, the yield curve can become flat or even inverted. A flat yield curve is one in which all yields are very close to one another. An inverted yield curve happens when shorter-term yields are actually higher than longer-term yields. Many people believe that a flat or inverted yield curve is a precursor to an economic recession or slowdown.
Lenders are willing to accept a lower long-term yield to lock in the current returns, while borrowers are willing to pay higher rates in the short term because they believe they'll be able to get more favorable long-term rates in the future.
Investors typically look at the very short end of the yield curve (the 90-day Treasury bill rate), the middle of the yield curve (the 10-year Treasury bond rate) and the long end (the 30-year Treasury bond rate) to get a handle on the bond market.
When people in the investment management industry ask how the bond market did, the answer typically involves detailing what happened to both the 90-day Treasury bill and the 30-year Treasury bond.
