


The Tangent Line tool is a great option for exploring the instantaneous rate of change of a nonlinear function. Start with a fresh Graphs page and graph the equation f(x) = x3 – 3x2 – 2x + 6.
Here’s how it works:
Graph your function on the first available function on the entry line.
Adjust the window to reveal all your points of interest.
Press [MENU]→Points & Lines→Tangent to open the Tangent Line tool.
Click [CLICK] on the function graph, then press [CLICK] again to construct the tangent line.
Press [ESC] to exit the Tangent Line tool.
The second screen shows the result of these steps. You can drag the point of tangency to move the tangent line along the graph.
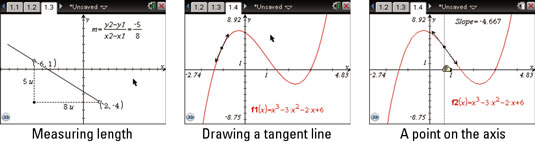
The third screen shows an alternative approach to this construction. Here, a line is constructed perpendicular to the x-axis. Then the point of intersection of this perpendicular line is constructed with the function. Then, the tangent to this point of intersection is constructed.
Under this scenario, you can move the tangent line by dragging the point of intersection of the x-axis and the perpendicular line. The tangent line moves along the curve more smoothly. Finally, press [MENU]→Measurement to measure the slope of the tangent line.
