When studying economics, you probably used the F distribution in your statistics class to compare variances of two different normal distributions. In econometrics, you have a similar use for the F distribution. You’ll find that the F distribution is easier to use if you’re familiar with some of its characteristics.
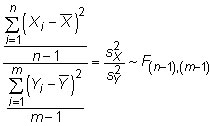
The F distribution is derived from a ratio of a two chi-squared distributions divided by their respective degrees of freedom. The F distribution tends to be right-skewed, with the amount of skewness depending on the degrees of freedom. As the degrees of freedom in the numerator and denominator increase, the F distribution approaches a normal distribution.
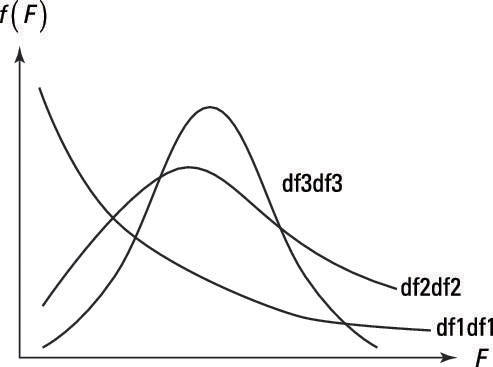
The figure shows how the F distribution changes with your degrees of freedom. The df1df1, df2df2, and df3df3 indicate increasing degrees of freedom (or observations) in both the numerator and denominator. The skewness of the F distribution decreases when the numerator or denominator degrees of freedom increase and approaches a normal distribution when both become large.
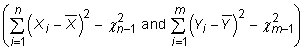
If X and Y are two normally distributed random variables, then the squared deviations of the X and Y values from their mean have a chi-squared distribution
When you take the ratio of the chi-squared distributions and divide each by its degrees of freedom, you end up with an F distribution: