


Confidence intervals give you a way of quantifying how much variation will appear in repeated measurements and statistical calculations for Six Sigma. Knowing how to create confidence intervals, you’ll be able to tell your boss, “With 99.7 percent certainty, our average pen diameter will be within our customer’s requirement.” You see averages every day. Unfortunately, very few of them are communicated with a confidence interval.
Very often, you need to determine whether two or more items are different and, if so, by how much. Examples include the following:
Are the operators of a process different?
Do two alternative manufacturing processes lead to significantly different outputs?
Is the gas mileage of Car A better than Cars B and C?
Are the marketing collateral materials with color graphics really better at generating leads than black-and-white equivalents?
You can use confidence intervals for population averages (μs) to verify differences between any two or more versions of the same outcome. Here’s how:
Take samples from each of the different versions or conditions you’re comparing.
Calculate the appropriate confidence interval for each different version or condition of the characteristic.
If your sample has fewer than 30 data points, you need to use the t formula to calculate the confidence interval. Also remember to use the same confidence level for each condition or version you’re comparing.
Graphically or numerically determine whether the confidence intervals of the different versions or conditions overlap at all.
If overlap does exist between any of the confidence intervals, you can say with your decided level of confidence that no difference exists between the overlapping versions.
On the other hand, if you don’t see any overlap, you can know right away that a difference does exist between the different versions of the output.
Here is a graphical comparison of the 95-percent confidence intervals for the average items-per-hour output for three types of computer systems.
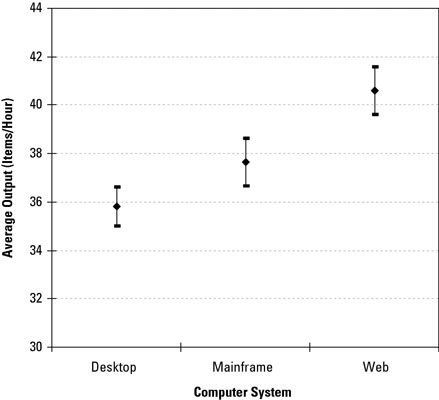
Graphically comparing the confidence intervals for the average performance clearly shows no overlap in the intervals. So with 95-percent confidence, you can say that the web computer system is better than the mainframe computer system (better on average by three items per hour) and that the web computer system is better than the desktop computer system (better on average by almost five items per hour).
If you had seen an overlap between any of the three computer system options, you would have concluded (with 95 percent confidence) that no significant difference occurred between the overlapping versions.
