


The Solver add-in works by applying iterative methods to find the “best” solution given the inputs, desired solution, and the constraints that you impose. With each iteration, the program applies a trial-and-error method (based on the use of linear or nonlinear equations and inequalities) that attempts to get closer to the optimum solution.
When using the Solver add-in, keep in mind that many problems, especially the more complicated ones, have many solutions. Although the Solver returns the optimum solution, given the starting values, the variables that can change, and the constraints that you define, this solution is often not the only one possible and, in fact, may not be the best solution for you. To be sure that you are finding the best solution, you may want to run the Solver more than once, adjusting the initial values each time you solve the problem.
When setting up the problem for the Solver add-in in your Excel worksheet, define the following items:
- Objective cell: The target cell in your worksheet whose value is to be maximized, minimized, or made to reach a particular value. Note that this cell must contain a formula.
- Variable cells: The changing cells in your worksheet whose values are to be adjusted until the answer is found.
- Constraint cells: The cells that contain the limits that you impose on the changing values in the variable cells and/or the target cell in the objective cell.
You can use the Solver add-in with the Scenario Manager to help set up a problem to solve or to save a solution so that you can view it at a later date. The changing cells that you define for the Scenario Manager are automatically picked up and used by the Solver when you select this command, and vice versa. Also, you can save the Solver’s solution to a problem as a scenario (by clicking the Save Scenario button in the Solver dialog box) that you can then view with the Scenario Manager.
Setting up and defining the problem in Excel 2019
The first step in setting up a problem for the Solver to work on is to create the worksheet model for which you will define the objective cell, variables cells, and the constraint cells.Keep in mind that the Solver is an add-in utility. This means that, before you can use it, you need to make sure that the Solver add-in program is still loaded, as indicated by the appearance of the Solver button in the Analysis group at the end of the Data tab on the Ribbon. If this button is missing, you can load Solver by opening the Add-Ins tab of the Excel Options dialog box (Alt+FTAA) and then clicking the Go button after making sure that Excel Add-Ins is displayed in the Manage drop-down list box to its immediate left. Then, select the Solver Add-in check box in the Add-Ins dialog box to put a check mark in it before you click OK to close the dialog box and reload the add-in.
To define and solve a problem with the Solver add-in after you’ve loaded the add-in and have created your worksheet model, you follow these steps:
- Click the Solver command button in the Analyze group at the end of the Ribbon’s Data tab.
Excel opens the Solver Parameters dialog box.
 Specifying the parameters to apply to the model in the Solver Parameters dialog box.
 - Click the target cell in the worksheet or enter its cell reference or range name in the Set Objective text box.
Next, you need to select the To setting. Click the Max option button when you want the target cell’s value to be as large as possible. Click the Min option button when you want the target cell’s value to be as small as possible. Click the Value Of option button and then enter a value in the associated text box when you want the target cell’s value to reach a particular value.
- Click the appropriate option button option in the To section of the dialog box. If you select the Value Of option button, enter the value to match in the associated text box.
Next, designate the variable cells — that is, the ones Solver can change to reach your Equal To goal.
- Click the By Changing Variable Cells text box and then select the cells to change in the worksheet or enter their cell references or range name in the text box.
Remember that to select nonadjacent cells in the worksheet, you need to hold down the Ctrl key as you click each cell in the selection. To have Excel choose the changing cells for you based on the target cell that you selected, click the Guess button to the right of this text box.
Before having Solver adjust your model, you may add constraints for the target cell or any of the changing cells that determine its limits when adjusting the values.
- (Optional) Click the Add button to the right of the Subject to the Constraints list box in the Solver Parameters dialog box.
This action opens the Add Constraint dialog box. When defining a constraint, choose the cell whose value you want to constrain or select the cell in the worksheet or enter its cell reference in the Cell Reference text box. Then select the relationship (=, <=, >=, or int for integer or bin for binary) from the drop-down list box to the right and (unless you chose int or bin) enter the appropriate value or cell reference in the Constraint text box.
To continue adding constraints for other cells used by the Solver, click the Add button to add the constraint and clear the text boxes in the Add Constraint dialog box. Then, repeat Step 5 to add a new constraint. After you finish defining constraints for the target cell and changing values in the model, click OK to close the Add Constraint dialog box and return to the Solver Parameters dialog box (which now lists your constraints in the Subject to the Constraints list box).
- (Optional) Deselect the Make Unconstrained Variables Non-Negative check box if you want to allow negative values when the variable cells are not subject to constraints.
By default, the Solver Add-in employs the GRG (Generalized Reduced Gradient) Nonlinear method in solving the model whose parameters you’re setting known as a very efficient way to solve smooth nonlinear problems. To use the LP Simplex method (for Linear Programming following the Simplex algorithm) or Evolutionary engine for solving non-smooth problems, you need to follow Step 7. - (Optional) Select LP Simplex or Evolutionary from the Select a Solving Method drop-down list to use either one of these methods solving nonsmooth problems.
- Click the Solve button to have the Solver solve the problem as you’ve defined it in the Solver Parameters dialog box.
Solving the problem with Excel’s Solver
When you click the Solve button, the Solver Parameters dialog box disappears, and the status bar indicates that the Solver is setting up the problem and then keeps you informed of the progress in solving the problem by showing the number of the intermediate (or trial) solutions as they are tried. To interrupt the solution process at any time before Excel calculates the last iteration, press the Esc key. Excel then displays the Show Trial Solution dialog box, informing you that the solution process has been paused. To continue the solution process, click the Continue button. To abort the solution process, click the Stop button.When Excel finishes the solution process, the Solver Results dialog box appears. This dialog box informs you whether the Solver was able to find a solution, given the target cell, changing cells, and constraints defined for the problem. To retain the changes that the Solver makes in your worksheet model, leave the Keep Solver Solution option button selected and click OK to close the Solver Results dialog box. To return the original values to the worksheet, click the Restore Original Values option button instead. To save the changes as a scenario before you restore the original values, click the Save Scenario button and assign a name to the current scenario before you click the Restore Original Values option and OK button.
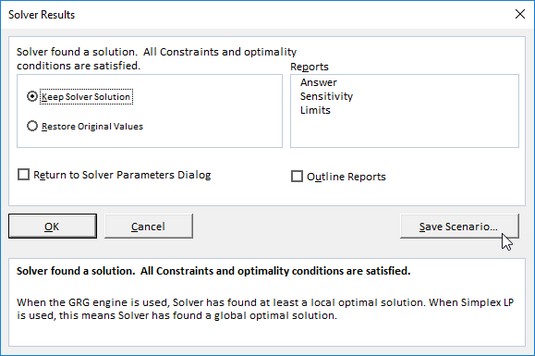 The Solver Results dialog box showing that Solver found a solution to the problem.
Unlike when using the Goal Seek command, after clicking the Keep Solver Solution option button in the Solver Results dialog box, you can’t use the Undo command button on the Quick Access toolbar to restore the original values to your worksheet. If you want to be able to switch between the “before” and “after” views of your worksheet, you must save the changes with the Save Scenario button and then select the Restore Original Values option button. That way, you can retain the “before” view in the original worksheet and use the Scenario Manager to display the “after” view created by the Solver.
Changing Excel’s Solver options
For most of the problems, the default options used by the Solver are adequate. In some situations, however, you may want to change some of the Solver options before you begin the solution process. To change the solution options, click the Options button in the Solver Parameters dialog box. Excel then opens the Options dialog box with the All Methods tab selected where you can make all necessary changes.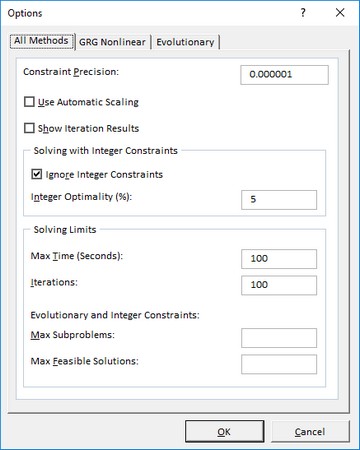 Modifying the solution options in the Options dialog box.
| Option | Function |
| Constraint Precision | Specifies the precision of the constraints. The number that you enter in this text box determines whether the value in a constraint cell meets the specified value or the upper or lower limit you have set. Specify a lower number (between 0 and 1) to reduce the time it takes the Solver to return a solution to your problem. |
| Use Automatic Scaling | Select this check box to have the Solver automatically scale the results when solving the problem. |
| Show Iteration Results | Select this check box to have the Solver show the results for the iterations followed in solving the problem. |
| Ignore Integer Constraints | Select this check box to have the Solver ignore any constraints you specify that use integers. |
| Integer Optimality (%) | Specifies the percentage of integer optimality criteria that the Solver applies in solving the problem. |
| Max Time (seconds) | Specifies the maximum number of seconds that the Solver will spend on finding the solution. |
| Iterations | Specifies the maximum number of times that the Solver will recalculate the worksheet when finding the solution. |
| Max Subproblems | Specifies the maximum number of subproblems that the Solver takes on when using the Evolutionary method to solve the problem. |
| Max Feasible Solutions | Specifies the maximum number of feasible solutions that the Solver will pursue when you select the Evolutionary method for solving the problem. |
When you use the default GRG (Generalized Reduced Gradient) Nonlinear or Evolutionary method, you can set additional Solver settings using the options on the GRG Nonlinear and Evolutionary tabs of the Options dialog box. These options include changing the Converge, Population Size, and Random Seed settings for either of these particular methods.
Saving and loading a model problem in Excel 2019
The objective cell, variable cells, constraint cells, and Solver options that you most recently used are saved as part of the Excel worksheet when you click the Save button on the Quick Access toolbar (Ctrl+S). When you define other problems for the same worksheet that you want to save, you must click the Save Model button in the Solver Options dialog box and indicate the cell reference or name of the range in the active worksheet where you want the problem’s parameters to be inserted.When you click the Load/Save button, Excel opens the Load/Save Model dialog box, containing a Select Model Area text box. This text box contains the cell references for a range large enough to hold all the problem’s parameters, starting with the active cell. To save the problem’s parameters in this range, click OK. If this range includes cells with existing data, you need to modify the cell reference in this text box before you click OK to prevent Excel from replacing the existing data.
After you click OK, Excel copies the problem’s parameters in the specified range. These values are then saved as part of the worksheet the next time you save the workbook. To reuse these problem parameters when solving a problem, you simply need to open the Solver Options dialog box, click the Load/Save button to open the Load/Save Model dialog box, click the Load button, and then select the range containing the saved problem parameters. When you click OK in the Load Model dialog box, Excel loads the parameters from this cell range into the appropriate text boxes in the Solver Parameters dialog box. You can then close the Solver Options dialog box by clicking OK, and you can solve the problem by using these parameters by clicking the Solve command button.
Remember that you can use the Reset All button whenever you want to clear all the parameters defined for the previous problem and return the Solver options to their defaults.
Creating Solver reports in Excel 2019
You can create three different types of reports with the Solver:- Answer report: Lists the target cell and changing cells with their original and final values, along with the constraints used in solving the problem.
- Sensitivity report: Indicates how sensitive an optimal solution is to changes in the formulas that calculate the target cell and constraints. The report shows the changing cells with their final values and the reduced gradient for each cell. (The reduced gradient measures the objective per unit increase in the changing cell.) If you defined constraints, the Sensitivity report lists them with their final values and the Lagrange multiplier for each constraint. (The Lagrange multiplier measures the objective per unit increase that appears in the right side of the constraint equation.)
- Limits report: Shows the target cell and the changing cells with their values, lower and upper limits, and target results. The lower limit represents the lowest value that a changing cell can have while fixing the values of all other cells and still satisfying the constraints. The upper limit represents the highest value that will do this.
When you click OK to close the Solver Results dialog box (after choosing between the Keep Solver Solution and Restore Original Values options), Excel generates the report (or reports) that you selected in a new worksheet that it adds to the beginning of the workbook. (Report sheet tabs are named by report type, as in Answer Report 1, Sensitivity Report 1, and Limits Report 1.)


