


If you right-click a pivot chart's plot area — the area that shows the plotted data — Excel displays a shortcut menu. Choose the last command on this menu, Format Plot Area, and Excel displays the Format Plot Area pane, as shown here.
This dialog box provides several collections of buttons and boxes you can use to specify the line background fill color and pattern, the line and line style, any shadowing, and any third-dimension visual effect for the chart.
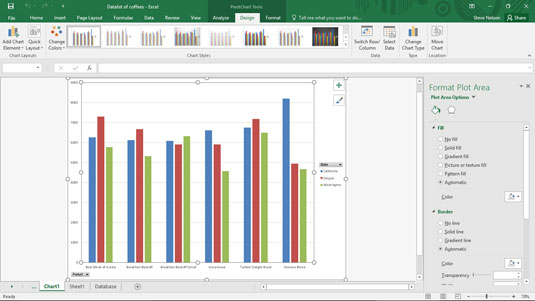
For example, to add a background fill to the plot area, select Fill from the list box on the left side of the Format Plot Area pane. Then make your choices from the radio buttons and drop-down lists available.
It would take pages to describe in painful and tedious detail the buttons and boxes that these formatting choices provide, but if you're really interested in fiddling with the pivot chart plot area fill effects, just noodle around. You'll easily be able to see what effect your changes and customizations have.

