


As the building block for your Excel reports, the data in your data models needs to be structured appropriately. Not all datasets are created equal. Although some datasets work in a standard Excel environment, they may not work for data modeling purposes. Before building your data model, ensure that your source data is appropriately structured for dashboarding purposes.
At the risk of oversimplification, datasets typically used in Excel come in three fundamental forms:
The spreadsheet report
The flat data file
The tabular dataset
The punch line is that only flat data files and tabular datasets make for effective data models.
Spreadsheet reports make for ineffective data models
Spreadsheet reports display highly formatted, summarized data and are often designed as presentation tools for management or executive users. A typical spreadsheet report makes judicious use of empty space for formatting, repeats data for aesthetic purposes, and presents only high-level analysis. The following figure illustrates a spreadsheet report.
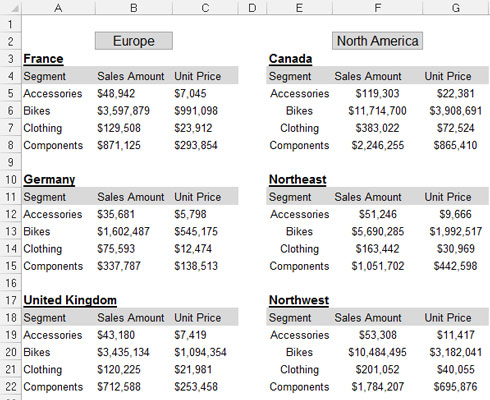
Although a spreadsheet report may look nice, it doesn't make for an effective data model. Why? The primary reason is that these reports offer you no separation of data, analysis, and presentation. You're essentially locked into one analysis.
Although you could make charts from the report shown, it'd be impractical to apply any analysis outside what's already there. For instance, how would you calculate and present the average of all bike sales using this particular report? How would you calculate a list of the top ten best-performing markets?
With this setup, you're forced into very manual processes that are difficult to maintain month after month. Any analysis outside the high-level ones already in the report is basic at best — even with fancy formulas. Furthermore, what happens when you're required to show bike sales by month? When your data model requires analysis with data that isn't in the spreadsheet report, you're forced to search for another dataset.
Flat data files lend themselves nicely to data models
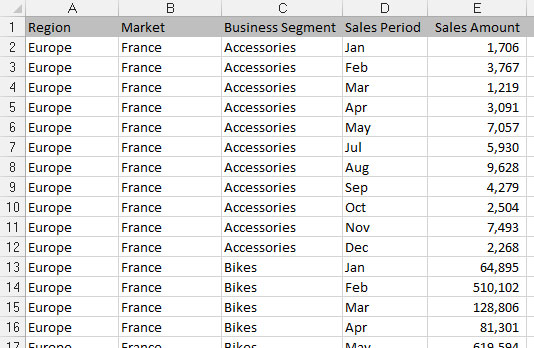
Another type of file format is a flat file. Flat files are data repositories organized by row and column. Each row corresponds to a set of data elements, or a record. Each column is a field. A field corresponds to a unique data element in a record. The following figure contains the same data as the previous report but expressed in a flat data file format.

Notice that every data field has a column, and every column corresponds to one data element. Furthermore, there's no extra spacing, and each row (or record) corresponds to a unique set of information. But the key attribute that makes this a flat file is that no single field uniquely identifies a record. In fact, you'd have to specify four separate fields (Region, Market, Business Segment, and a month's sales amount) before you could uniquely identify the record.
Flat files lend themselves nicely to data modeling in Excel because they can be detailed enough to hold the data you need and still be conducive to a wide array of analysis with simple formulas — SUM, AVERAGE, VLOOKUP, and SUMIF, just to name a few.
Tabular datasets are perfect for pivot table–driven data models
Many effective data models are driven primarily by pivot tables. Pivot tables are Excel's premier analysis tools. For those of you who have used pivot tables, you know they offer an excellent way to summarize and shape data for use by reporting components, such as charts and tables.
Tabular datasets are ideal for pivot table–driven data models. The following figure illustrates a tabular dataset. Note that the primary difference between a tabular dataset and a flat data file is that in tabular datasets the column labels don't double as actual data. For instance, the Sales Period column contains the month identifier. This subtle difference in structure is what makes tabular datasets optimal data sources for pivot tables. This structure ensures that key pivot table functions, such as sorting and grouping, work the way they should.
The attributes of a tabular dataset are as follows:
The first row of the dataset contains field labels that describe the information in each column.
The column labels don't pull double duty as data items that can be used as filters or query criteria (such as months, dates, years, regions, or markets).
There are no blank rows or columns — every column has a heading, and a value is in every row.
Each column represents a unique category of data.
Each row represents individual items in each column.


