

Adobe's Analytics Implementation Guide
You might be too young to remember, but people used to buy software apps from stores, and the apps came with a book documenting how to use the app. Adobe's Analytics Implementation Guide plays that role. This soup-to-nuts set of resources from Adobe provides a macro guide and a micro guide to the tasks you need to complete to implement Analytics.Much of the material in the Analytics Implementation Guide is presented as downloadable PDFs. Those PDFs are supplemented with a wide range of video tutorials.
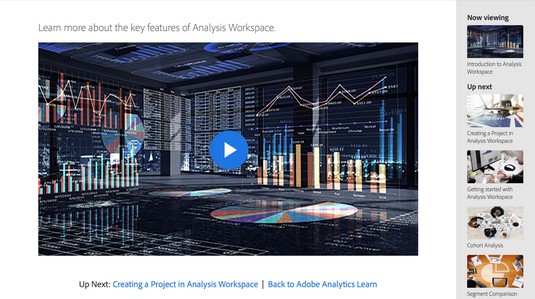 The first in a series of video tutorials from Adobe introduces key features of Analytics Workspace.
To provide a menu of sorts as to what you ‘ll find in the Implementation Guide, we’ve curated a set of key topics. It’s a god idea to visit the site, bookmark it, and note available white papers, documentation, and videos. You’ll want to keep this site handy as you engage in deeper levels of Adobe Analytics.
Topics include the following:
- Discovery and requirements: How to define your analytics goals and gather requirements for the implementation, starting with developing and documenting an objective understanding of the website and its business goals. During this phase, your consultant or partner gathers measurement requirements.
What Adobe calls “gather[ing> measurement requirements” is synonymous with what are often called creating a business requirements document (BRD). This document maps the goals of a website or app to the overall business goal of the enterprise, and suggests industry best practices.
- Installation and provisioning: How to set up Adobe Analytics and get an email with login credentials.
- Configuration and implementation: What you need to have in place before launching Analytics, including documenting a solution design reference document and a tech spec. The solution design reference document contains an overview of the website data layer, launch elements/rules, and Adobe Analytics variables. The tech spec is detailed documentation on how to implement each component of the solutions and how to validate them.
- Post implementation: In this phase of unrolling Analytics, you work with a consultant or partner to identify data accessible through Adobe Analytics, and brainstorm how to use that data to optimize your digital business. This phase also includes enabling various time-saving features of Adobe Analytics, such as Report Scheduler, Workspace, and Microsoft Report Builder. (Report Builder is a Windows-only plug-in.)
- Implementation resources: Here you find links to three comprehensive additional resources and documentation for Adobe Analytics. Those resources follow:
- The Analytics Implementation Guide (a downloadable PDF)
- Analytics Implementation Training (training resources for your team)
- Analytics Video Learning (a library of helpful videos)
A data analytics measurement plan for your Adobe Analytics strategy
Measurement plans are emphasized in this top-ten list because they are the foundation on which successful analytics frameworks are built. The article “How to Create a Measurement Plan and Why You Really Need One” is a useful discussion of measurement plans. And, as the title implies, it also provides specific tools for building a measurement plan.Those tools include a nicely formatted and thoughtfully designed Excel spreadsheet that serves as a template (and model) for a measurement plan, including creating an integrated strategy with a website measurement plan based on identified goals. The image below shows the template spreadsheet that comes with the article, as hosted at the UK-based freshegg site (thus the British spelling of Organisation).
 A model and a template spreadsheet for a measurement plan and an evaluation plan.
Data governance and Adobe Analytics
The article “Data Governance: The Key to Building Consistent, Outstanding Digital Experiences,” by Eric, identifies the conundrum that “more often than not, marketers have more data than they know what to do with — and that just might be their biggest problem.” The article draws on real-world experiences at Southwest Airlines and Zebra Technologies Corporation (which acquired Motorola). A summary of implementing Adobe Analytics to manage integrating acquisitions and rescaling their online presence.
The article and case study provide a concise argument for the following themes that run throughout this book:
- Keep analytics at the center of your data governance
- Invest in products, definition, and processes
- Train your team for success
- Pay the price for better digital experiences
Web analytics solution design
A solution design or solution design reference (SDR) connects the business requirements and goals defined in a measurement plan with the technical requirements necessary to successfully deploy analytics technology. The article “7 Steps to Set Up Your Web Analytics Solution Design” identifies and walks through seven strategic steps to developing an effective solution design to protect the integrity of your web analytics implementation.Also at this link is access to a half-hour webinar featuring Jason Call, senior data analytic expert at ObservePoint.
 A high-level exploration of SDR concepts.
Digital Analytics Power Hour
One of the most thorough, honest, and irreverent mediums for staying on top of the industry is via podcast. The three hosts of the Digital Analytics Power Hour — Michael Helbling, Tim Wilson, and Moe Kiss — provide their explicit feelings on a wide variety of analytics topics. The hosts often invite other people in the industry to ensure that multiple opinions are represented and new technologies and ways of thought are discussed. Figure 18-5 provides the podcast’s raison d'etre. About the DAPH podcast.
Analytics agencies and Adobe Analytics
The analytics agency world is chock full of smart and successful consultants. It would be impossible to link to all of their content, but here’s a few resources that are especially valuable to the growing Adobe Analytics analyst.The team at 33 Sticks shares a unique set of insights and experiences working with customers to implement digital analytics. Check out the blog articles and 33 Tangents podcasts episodes. The content addresses a wide range of topics from digital analytics to business and technology to remote work.
 The blog at 33 Sticks.
The masters at Analytics Demystified have been writing content about Adobe Analytics for more than 10 years. we highly recommend spending some time on their blog (https://analyticsdemystified.com/blog/) to learn about real-world applications of Adobe technology and how-to’s. Adam Greco’s content is especially valuable to both new and seasoned analysts.
Conferences, conferences, conferences…for the data analyst
Analytics enthusiasts are a tight-knit group of people who love to share and learn from each other. There is no better way to learn more about analytics, Adobe, and data industry trends than by attending and networking at analytics conferences. Some of our favorite industry events include the following:- Adobe SUMMIT: Adobe’s annual multiday conferences in Las Vegas, Nevada and London are worth every penny. These can’t-miss events are the preferred way for thousands of digital marketers and analysts to learn about Adobe’s vision, new features, and best practices. The thousands of attendees include successful business leaders, celebrities, and a who’s-who of the analytics industry — new friends and selfies encouraged!
 The 2019 SUMMIT conference home page.
 - Adobe Insider Tour: In addition to SUMMIT, Adobe hit the road for the first time in 2017 and the feedback has been impressively positive. These fun, free, half-day events bring members of the Adobe Analytics product team to cities around the world (from Chicago and Dallas to London and Sydney) to spread tips and tricks with Adobe solutions, provide a glimpse into the Adobe roadmap, and give Adobe partners and customers the chance to present. If the tour is coming to your city, you’ll be glad you took the time to enjoy the festivities. Sign up as an Adobe Insider to be informed.
- DA Hub and Measure Camp: Two of our favorite vendor-agnostic events are known as unconferences. An unconference aims to avoid the large keynotes, huge breakout sessions, and generic conversations that some larger conferences are known for. Instead, the unconference focuses on small huddles — group conversations — and a more tight-knit group of attendees. Attendees of these unconferences are a highly loyal group that you will want to meet and discuss analytics with.
The Adobe Experience League
Adobe’s Experience League is a repository of valuable information about Adobe Experience Cloud products. On this site, Adobe provides videos, tutorials, and a community forum. If you log in with your Adobe ID, you’ll receive a tailored experience based on content you’ve previously viewed and the features you use in Adobe products.The Adobe Analytics YouTube channel
The Adobe Analytics YouTube channel is one of the best ways to stay on top of new features and the latest best practices. The Adobe product team manages the content here, and you may even recognize the name of one of the common presenters — one of your two favorite analytics authors, Eric Matisoff!Every time Adobe releases new features or adds new functionality to old features, Adobe creates a playlist of three-to-five-minute videos explaining the changes. Over 10,000 subscribers regularly watch the 180+ videos that are to-the-point and easily accessible thanks to the well-organized YouTube playlists that Adobe has created. The following image shows a comparison of segments in Adobe Analytics. Subscribe today!
 Comparing more than one segment in a report.
Hacking the Bracket with Adobe Analytics
You can easily draw on sports to understand and apply analytics. The fun, interactive site Hack the Bracket draws on data processed by Adobe Analytics to predict the outcome of NCAA basketball championship matchups. Playing Hack the Bracket with Adobe Analytics.
Sound like fun? Try it! Of course, Adobe does not make any warranties about the completeness, reliability, and accuracy of the predictions, and any action you take on the predictions provided is strictly at your own risk.


