

In our weather forecast, metrics are all the numbers in the table — the high, the low, the precipitation percentage, and the humidity percentage. Metrics are exclusively numbers but you can format them as percentages, currencies, decimals, and more.
Metrics are often the most commonly discussed category of measurement for digital analysts. A standard question that an analyst at a B2B company receives is “How many leads did the website generate this week?” This question refers to the leads metric and is one of the most critical metrics captured on a B2B’s website.
Having explored how metrics are posed in real life, let’s take a look at how metrics are applied in Analysis Workspace.
Defining hits with Adobe Analytics
One key metric that is essential when discussing Adobe Analytics but isn’t available in the Workspace interface is called hits. A hit describes any interaction on your site or app that results in data being sent to Adobe Analytics. It’s a catchall for page views, download links, exit links, and any custom tracking.Measuring page views with Adobe Analytics
Let’s start with the most simple of metrics in Adobe Analytics — page views. The page views metric displays the number of times your HTML files or web pages (or sections of a page) were loaded.When analyzing a mobile app, page views correspond to the number of times your app’s screens were loaded in the app. Mobile phone screens are much smaller than laptops and desktop monitors, and the definition of an app’s screen is often unique within a company. Work with your Adobe administrators for a complete list of app screens, or at least request the rule of thumb they use to decide whether new content should be considered a new screen, and therefore a page view.
Every time your home page is loaded by a person browsing your site, that’s a page view. Similarly, every time your Contact page is loaded by a person browsing your site, that’s also a page view. The total count of page views increases with every page load.
As is the case with page dimensions, the definition of page views can be complicated on parallax sites and single-page applications. The good news is that your company’s definition of pages and page views will be aligned because of a bond between the dimension and metric so that any time a page is viewed, page views will be increased.
In the image below, the page view metric was applied to a range of dates, which provides a quick overview of traffic to pages over that date range.
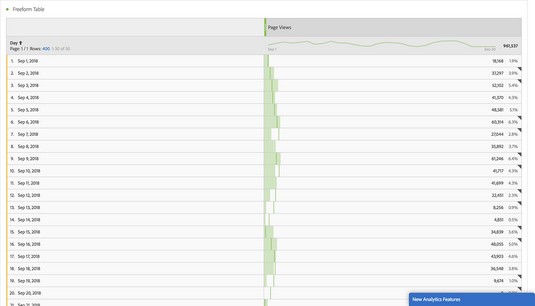 A page views metric in a freeform table in Analysis Workspace.
Counting visits with Adobe Analytics
Another standard metric in the web analytics world is the visits metric, also known as the sessions metric in Google Analytics. A visit is defined as an interaction or set of interactions by an individual that consists of one or more actions. The actions in a visit can occur on the same page or on multiple pages.Following are a few simple examples:
Visit example 1:
On Monday, Eric lands on your home page at 1 pm, and closes his browser at 1:05 pm.
Visit example 2:
On Tuesday, David lands on a product page at 11 am and watches a video on that page.
David gets distracted and closes his laptop at 11:08 am.
Visit example 3:
On Wednesday, Heidi lands on your home page at 7 pm.
She performs a search on your site and is taken to the search results page.
Heidi clicks the first link to a product.
She adds the product to the shopping cart is taken to the shopping cart page.
She successfully checks out and makes the purchase on the checkout page.
Heidi confirms her purchase on the purchase confirmation page at 7:22 pm.
Each of these three examples contains a different numbers of page views (one, two, and six). However, each of them would count as just a single visit.Bottom line: Visits and page views are related, but they are not the same thing. A visit can, and often does, involve more than one-page view.
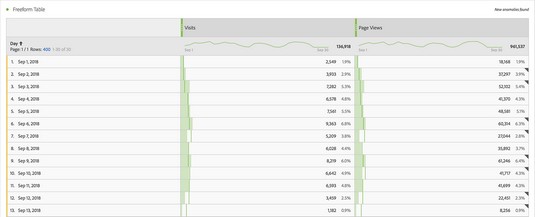 The visits and page views metrics in a freeform table in Analysis Workspace.
You may have noticed that a time is included at the end of all three examples. Including a time when the last interaction takes place is important because that is how you measure when a visit ends.
Have you ever wondered why you can’t simply measure when a visit ends by identifying when a user leaves a page? The reason is that technical limitations keep analytics platforms such as Adobe Analytics and Google Analytics from being able to detect the action of a browser tab or a window being closed.
As a result, analysts have had to get creative in how they define the end of a visit. A visit ends after a set amount of time passes without any data being sent from the individual.
By default, most analytics platforms, including Adobe Analytics, use 30 minutes of inactivity to define the end of a visit. However, you can adjust the amount of time that results in a visit’s end.
Identifying unique visitors with Adobe Analytics
The page views metric is the most granular and detailed standard metric. Multiple page views within a timeframe roll up into a visit, a less granular standard metric. Multiple visits roll up into a single unique visitor, which is the least granular standard metric.The number of unique visitors to a site or a page is the number of individuals with activity consisting of one or more visits to a site, an app, or a page. (Google Analytics uses the term users instead of unique visitors.) Note that unique visitors is different than individual people. Adobe Analytics has no way of knowing the difference between two people who share a computer or one person who accesses the same site from two different browsers on the same computer.
The image below is a table in Analysis Workspace displaying visits, page views, and unique visitors.
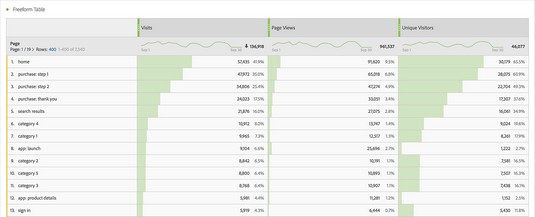 Viewing visits, page views and unique visitors in a freeform table in Analysis Workspace.
The unique visitors metric is based on cookies. If a cookie that identifies a browser is deleted, Adobe can't tie that individual’s visit history to any new visits. As a result, new visits will generate a new cookie and therefore appear as a new unique visitor. A more accurate definition for unique visitor would state that it’s the unique count of browser cookies, but that’s not as much fun as just calling them people.
Adobe Analytics has a standard metric to identify unique visitors called the people metric, but it’s accessible only to Adobe customers who participate in Adobe’s Device Co-op.
Understanding deduplication when using Adobe Analytics
Now that you’ve learned about metrics with three different levels of granularity (page views, visits, and visitors) but only one dimension (page), it’s important to think about how they all come together. The flexibility of Adobe Analytics demands that you have a certain level of understanding of deduplication. A duplicate is an identical copy of something. When measuring user interaction with a website, it's often helpful to deduplicate — to strip out duplicate activity.Let’s explore an example:
- Nolan views a home page.
- Nolan views an article page.
- Nolan views the home page again.
But if you add a second metric of visits to this table, the home page has one visit and two-page views and, the article page has one visit. Why one visit but two-page views for the home page? The visits metric is deduplicated, meaning it is counted only one time during the entirety of the visit. In fact, Nolan could have gone back and forth between the home page and the same article page 50 times, and each of those two pages would still get only one visit each.
Adobe deduplicates the visits metric regardless of dimension; no matter how many times a dimensional value is sent in a visit, the visits metric is counted only once.
Let’s expand our example by adding a second visit, this one coming a week later:
- Nolan views the home page.
- Nolan views a product page.
- Nolan views the home page again.
Trending metrics in Adobe Analytics
If you think about your future as an analyst, you might imagine yourself discovering an incredible change in data that saves your company millions. In this dream, perhaps you’ve discovered several expensive products that customers can’t buy due to a website coding error!For you to discover this error, you’d have to take advantage of trending, one of the most common activities you’ll do with metrics in Adobe Analytics. Trending a metric means that you're analyzing a specific metric's change over time.
You can trend metrics in Adobe Analytics over any period of time with any granularity. You can trend page views per month for an entire year, or trend page views per hour for just a day. In both examples, you still have a metric and a dimension. The metric is page views and the dimension is the unit of time granularity you’ve specified for your table.
In Analysis Workspace, you can build this table on your own, dragging in the metric and dimension, or you can use the one-click Visualize icon in any row in any table.
Calculating metrics with Adobe Analytics
Analysts must be able to apply calculations to their metrics that are flexible and adjustable on the fly, an area in which Adobe excels. To continue with our weather forecast example, you may want to convert the high and low temperatures in the forecast from Fahrenheit to Celsius. The formula is subtract 32 from the Fahrenheit temperature, and then multiply by 5/9. This new metric can be considered a calculated metric.Let’s take an example in the analytics world: An Adobe analyst is in a situation where unique visitors shoots up. Before declaring success, the analyst digs in further to some additional context by adding page views as a metric. In our example the analyst notices something strange — page views has barely increased, just a few more than the increased number of visitors.
The best recommendation offered to analysts is to create a calculated metric of page views per visitor. This simple metric, dividing page views by unique visitors, is one of the most basic calculated metrics in the digital analytics industry.
In the example, the analyst may end up trending the calculated metric and discovering that although visitors increased significantly, page views per visitor dropped precipitously. Most likely this means that unqualified traffic is accessing the site, so our recommendation is to break that data down by other dimensions to better understand these disinterested visitors.
Calculated metrics get significantly more complex than dividing one metric by another. In Adobe, calculated metrics utilize all the standard math operators (division, multiplication, subtraction, and addition) and a wealth of advanced functions, such as square root, exponents, and percentiles. You can also apply logical operators (such as greater than and less than) and even segments to calculated metrics!
Having a greater understanding of these metrics will help you develop a strategic approach to your web and mobile strategies.


