Data analysis takes many forms. Sometimes, you need to look for patterns in data in a manner that you might not have initially considered. One common way to perform such an analysis is to use a Fast Fourier Transform (FFT) to convert the sound from the frequency domain to the time domain. Doing this lets you plot the sound in a new way.
For example, think about a mechanic who takes a sound sample of an engine and then relies on a machine to analyze that sample, looking for potential engine problems. The diagnostic can find some problems and visual inspection can find others, but sometimes the sound of an engine reveals issues that you can’t find in any other way.
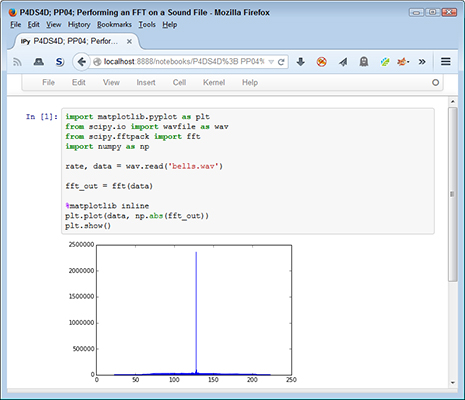
Here’s the code you use to perform an FFT:
import matplotlib.pyplot as plt
from scipy.io import wavfile as wav
from scipy.fftpack import fft
import numpy as np
rate, data = wav.read('bells.wav')
fft_out = fft(data)
%matplotlib inline
plt.plot(data, np.abs(fft_out))
plt.show()
In this case, you begin by reading in the sound file and extracting the data from it. The rate information isn’t important because you don’t need to know how fast to play the data, you simply need to know what values the sound contains. The sound values consist of frequency (the tone of the sound) and amplitude (how loud to play it).
The next step is to perform the FFT by calling fft() with data. This particular analysis is a simplification of a much larger process. The point is that the output displays the strongest detected frequencies over time.