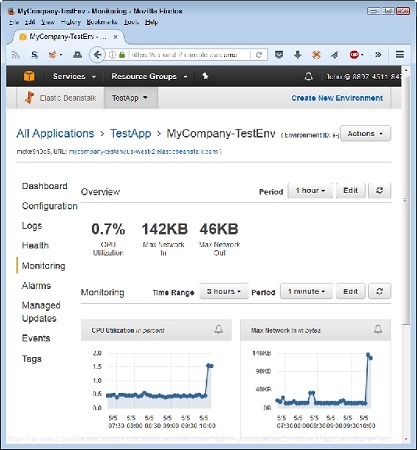
 Monitor your application to determine when it requires environment changes.
The test application uses hardly any of the resources provided to it, so you don’t need to make any changes. Of course, this is an expected outcome given that you’re the only one with access to the application. The line graphs below the text output show graphically how many resources your application uses. You can also change the monitoring criteria for longer monitoring sessions (to show generalized trends over a 24-hour period, for example).
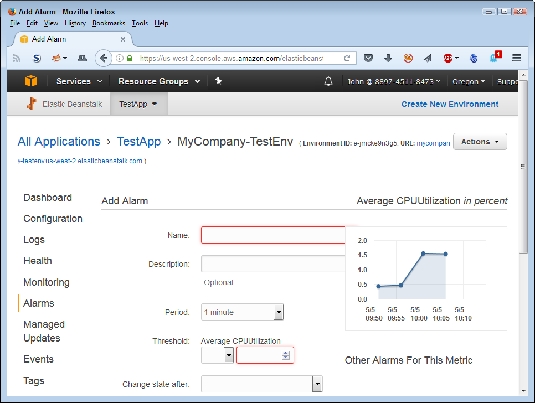
Each of the graphs has a button associated with it. When you click the button, you see a page for creating an alarm. Each alarm entry must have a unique name. You then provide a monitoring period, metric-specific thresholds, and notification information. When you complete the form, click Add. You can see the alarms you set for your EB application by choosing Alarms in the Navigation pane. When an alarm occurs, a message about it comes to you through the notification method (such as an email message) that you selected.
 Set alarms as needed to prevent failures because of lack of resources.


