


The ZoomFit and ZoomStat zoom commands on the TI-84 Plus calculator help you find an appropriate viewing window for the graph of your functions. The ZSquare and ZInteger zoom commands readjust the viewing window of an already graphed function.
ZoomFit zoom command on the TI-84 Plus
This is a really neat Zoom command! If you know how you want to set the x-axis, ZoomFit automatically figures out the appropriate settings for the y-axis.
To use ZoomFit, press [WINDOW] and enter the values you want for Xmin, Xmax, and Xscl. See the first screen. Then press [ZOOM][0] to get ZoomFit to figure out the y-settings and graph your function. See the second screen. ZoomFit does not figure out an appropriate setting for Yscl, so you may want to go back to the Window editor and adjust this value.
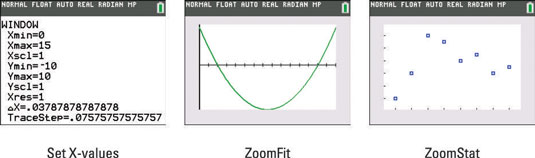
ZoomStat zoom command on the TI-84 Plus calculator
If you’re graphing functions, this command is useless. But if you’re graphing Stat Plots, this command finds the appropriate viewing window for your plots. See the third screen.
The TI-84 Plus calculator's ZSquare zoom command
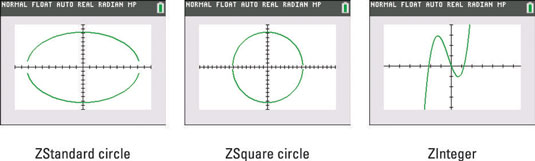
Because the calculator screen isn’t perfectly square, graphed circles won’t look like real circles unless the viewing window is properly set. ZSquare readjusts the existing Window settings for you and then regraphs the function in a viewing window in which circles look like circles. Pictured in the first screen here is a circle in a ZStandard graphing window. See the difference a ZSquare window makes, as shown in the second screen.
To use ZSquare, graph the function and then press [ZOOM][5]. The graph automatically appears.
The TI-84 Plus calculator's ZInteger zoom command
This command is quite useful when you want the Trace cursor to trace your functions using integer values of the x-coordinate, such as when graphing a function that defines a sequence. ZInteger readjusts the existing Window settings and regraphs the function in a viewing window in which the Trace cursor displays integer values for the x-coordinate. In addition, ZInteger sets the Xscl and Yscl to 10.
To use ZInteger, graph the function and then press [ZOOM][8]. Use the
keys to move the cursor to the spot on the screen that will become the center of the new screen. Then press [ENTER]. The graph is redrawn centered at the cursor location. See the third screen.


