


You can create a histogram on the TI-Nspire. Press [MENU]→Plot Type→Histogram (or right-click near the middle of the screen and choose Histogram) to display single-variable data as a histogram. The first screen shows a histogram of the total data.
The number of bins, the name given for the bars in a histogram, is determined by the number of data sets and the distribution of the data. As shown in the first screen, you can click a bin to display the width of the bin and the number of values contained in the bin.
How to change a histogram scale
Press [MENU]→Plot Properties→Histogram Properties→Histogram Scale and select a scale for your histogram, as follows:
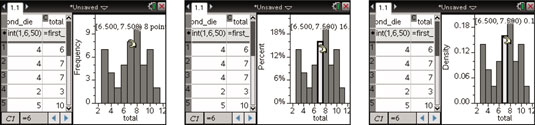
Frequency: By default, histograms give the frequency of each bin. This scale tells you how many values are contained in each bin. Referring to the first screen, eight values are contained in the bin ranging from 6.5 to7.5.
Percent: Press [MENU]→Plot Properties→Histogram Properties→Histogram Scale→Percent to change the scale to percent. This scale tells you the percent of all values that are contained in each bin. The second screen shows that 16 percent of all values fall in the bin from 6.5 to 7.5, which makes sense because the ratio 8 out of 50 is equal to 16 percent.
Density: Press [MENU]→Plot Properties→Histogram Properties→Histogram Scale→Density to change the scale to density. (See the third screen.) The density is calculated by dividing the relative frequency of a bin by the bin width.
How to adjust the histogram bins
To adjust the bin width, follow these steps:
Move the cursor to the right edge of any bin until the

symbol appears.
Press [CTRL][CLICK] to grab the bin and use the Touchpad keys to adjust the width.
Notice that the numerical value associated with right edge of the bin is displayed.
Press [ESC] when finished.
To adjust the bin width numerically, follow these steps:
Press [MENU]→Plot Properties→Histogram Properties→Bin Settings (or right-click on a bar and choose Bin Settings).
Configure the dialog box for a desired bin width and alignment.
The bin width is fairly self-explanatory — it sets the width of each bin of your histogram. The alignment is a bit trickier.
For example, if you specify a bin width of 2 with an alignment of 5, you can be assured that one of your bins has a right edge located at 5 with a width of 2. All other bins fall into place. A bin width of 2 and an alignment of 7 (or any odd integer) produces the same histogram.
Perhaps you want your bins to have a width of 1 and to be centered on the values represented by the possible two-dice sum outcomes. Use a bin width of 1 and any bin alignment with a decimal portion equal to 0.5. For example, a bin alignment of 7.5 works.
Press [ENTER] when finished.


