
By itself, total cost doesn't say much about the firm and still less about how it makes its decisions. Economists want to discover a little more about how the firm operates, so they look at the relationship between total cost and the number of units produced. To do so, they divide the cost of production by the number of units produced to derive the average costs.
Making use of average costs
Average costs or the cost per unit, measured at a level of production, are useful things to know in and of themselves, but they also have some important properties that economists use to find out about the efficiency of production. To compute average total cost (ATC), you divide total costs (TC) by the quantity produced (Q):
ATC = TC / Q
Now, here's an interesting thing. Total costs break down into fixed costs (FC) and variable costs (VC). Therefore you can divide each of these components by quantity of output produced to get average fixed costs (AFC) and average variable costs (AVC), which are the amount of fixed cost per unit and the amount of variable cost per unit, respectively. Or to put it another way:
ATC = TC / Q = (FC + VC) / Q = AFC + AVC
To discover an interesting feature of a firm's costs of production, take a look at average fixed costs. Fixed costs don't change whatever the level of production, but as you go on producing more and more, the AFC per unit falls as you divide by a higher level of output each time.
Here's a very simple example: A baker needs to incur a cost of $100 to set up his premises and can then make cakes for $2 per cake. The total cost is the sum of fixed and variable costs. Let Q denote the number of cakes produced. This allows us to write the following formula for his total costs:
TC = 100 + 2Q
Now divide through by quantity of cakes produced to get average total cost:
ATC = 100 / Q + 2
You can now plot some numbers for the average total cost (ATC), or more simply (AC). The table computes total and average costs according to this formula.
| Quantity Produced | 1 | 2 | 3 | 4 | 5 | 6 |
|---|---|---|---|---|---|---|
| Fixed cost | 100 | 100 | 100 | 100 | 100 | 100 |
| Variable cost | 2 | 4 | 6 | 8 | 10 | 12 |
| Total cost | 102 | 104 | 106 | 108 | 110 | 112 |
| Average total cost | 102 | 52 | 35.333 | 27 | 22 | 18.667 |
| Average fixed cost | 100 | 50 | 33.333 | 25 | 20 | 16.667 |
| Average variable cost | 2 | 2 | 2 | 2 | 2 | 2 |
Take a look at the average total cost row. If you notice that it falls as you add more units, that's good. Now look at the next two lines, the costs broken down into fixed and variable components. Note that the average fixed costs are particularly falling. Why?
Well, a fixed cost doesn't depend on how much a firm produces — it still has to pay the same cost. In this case, though, because it's making more units, the fixed cost is being divided by more units each time, which means that as the firm makes more, the average fixed cost gets smaller.
This fact is a key principle behind the concept of economies of scale. As the baker produces more cakes, he does so for a lower cost per cake.
Visualizing economies of scale by plotting average costs
One way to see how this works is to plot the average cost over a range of production. Generally the average cost curve is U-shaped. Over the range of output, as more gets made, the fixed costs get spread out over more output and average costs fall. Average costs stop falling when the increase in average variable costs in expanding production outweighs the decrease in average fixed costs. This does not happen in the table's example because average variable costs are constant and do not go up as production increases.
Average costs typically fall up to a point, beyond which the increase in average variable costs from adding an extra unit is greater than the decrease in average fixed costs by adding an extra unit. At this point, economists say that the firm has fully exploited economies of scale and is experiencing diseconomies of scale.
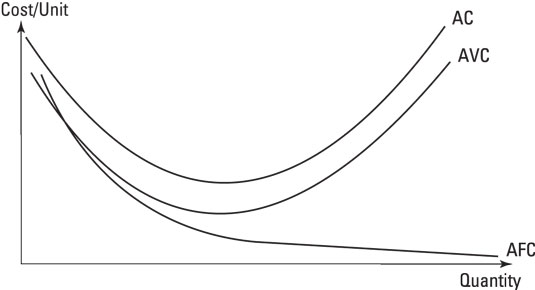
The following figure shows that average fixed cost is always falling, because the same number is divided by a bigger number each time, but that average variable costs start to rise beyond a certain point. That point, where the average cost of production rises again, is the minimum efficient scale of production and is important for considering the efficiency of a firm.