


When you’re given the graph of a function and your pre-calculus teacher asks you to find the limit, you read values from the graph — something you’ve been doing ever since you learned what a graph was! If you’re looking for a limit from the left, you follow that function from the left-hand side toward the x value in question. Repeat this process from the right to find the right-hand limit. If the y value being approached from the left is the same as the y-value being approached from the right (did the pencils meet?), that y value is the limit. Because the process of graphing a function can be long and complicated, you shouldn’t use the graphing approach unless you’ve been given the graph.
For example, find
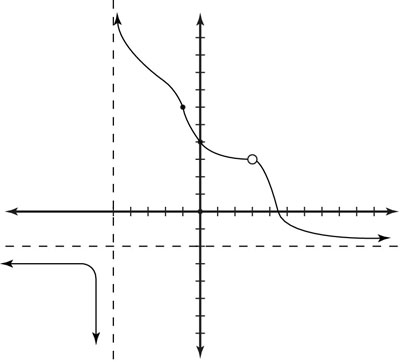
in the preceding figure.
You can see that as the x-value gets closer and closer to –1, the value of the function f(x) approaches 6. And in fact, when x gets to –1, the function’s value actually is 6! Technically, though, having f(–1) = 6 isn’t required in order to say that the limit is 6; the function could have a hole in it at that point, and the limit would still be 6! See the next example:
In the graph, you can see a hole in the function at x = 3, which means that the function is undefined — but that doesn’t mean you can’t state a limit. If you look at the function’s values from the left,
and from the right,
you see that the y value approaches 3. So you say that the limit of the function as x approaches 3 is 3.
You can see that the function has a vertical asymptote at x = –5. From the left, the function approaches negative infinity as it nears x = –5. You can express this mathematically as
From the right, the function approaches infinity as it nears x = –5. You write this situation as
Therefore, the limit doesn’t exist at this value, because the left-hand limit is negative infinity but the right-hand limit is infinity.
For a function to have a limit, the left and right limits must be the same. A function can have a hole in the graph at a particular x value but the limit as x approaches this value can still exist, like


