

You use datetick() to add dates to a plot axis in MATLAB. When using datetick(), you need an axis that has numbers that are in the range of the dates you need. For example, when you type datenum(‘9,15,2014’) and press Enter, you get an output value of 735857. When datetick() sees this value, it converts the number to a date.
The datenum() function also accepts time as input. When you type datenum(‘09/15/2014 08:00:00 AM’) and press Enter, you get 7.3586e+05 as output. Notice that the integer portion of the value is the same as before, but the decimal portion has changed to show the time.
If you don’t provide a time, the output is for midnight of the day you select. You can convert a numeric date back to a string date using the datestr() function.
The x-axis in this example uses date values. To create an x-axis data source, type XSource = linspace(datenum(‘09/15/2014’), datenum(‘09/19/2014’), 5); and press Enter. This act creates a vector that contains the dates from 09/15/2014 to 09/19/2014. The linspace() function returns a vector that contains the specified number of value (5 in this case) between the two values you specify.
To create the y-axis data source, type YSource = [1, 5, 9, 4, 3]; and press Enter. Type Bar1 = bar(XSource, YSource) and press Enter to create the required plot. The default tick spacing will show too many points, so type set(gca, ‘XTick’, linspace(datenum(‘09/15/2014’), datenum(‘09/19/2014’), 5)) and press Enter to set the tick spacing.
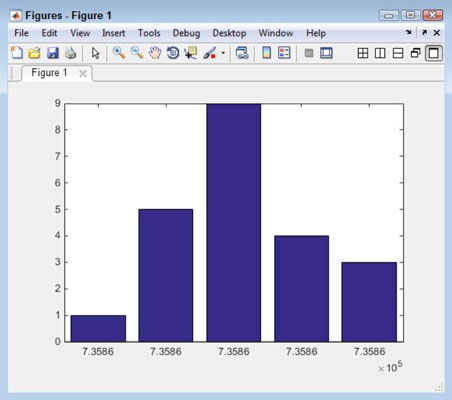
Notice that the x-axis doesn’t use the normal numbering scheme that begins with 1 — it uses a date number instead (expressed as an exponent rather than an integer). Even though the x-axis numbers look the same, you see in the next paragraph that they aren’t.
To turn the x-axis labels into dates, you now use the datetick() function. Type datetick(‘x’, ‘dd mmm yy’, ‘keeplimits’, ‘keepticks’) and press Enter.

All the arguments used with datetick() are optional. When you use datetick() by itself, the output appears on the x-axis using a two-digit month and a two-digit day. The end points also have dates, so instead of seeing just five dates, you see seven (one each for the ends). The example uses the following arguments in this order to modify how datetick() normally works:
Axis: Determines which axis to use. You can choose the x-, y-, or z-axis (when working with a 3D plot).
Date format: Specifies how the date should appear. You can either use a string containing the format as characters, or you can use a number to choose a default date option. (The two tables assume a datenum() value of ‘09/15/2014 08:00:00 AM’.) The example uses a custom format, so one of the numeric options won’t work.
'keeplimits': Prevents MATLAB from adding entries to either end of the axis. This means that the example plot retains five x-axis entries rather than getting seven.
'keepticks': Prevents MATLAB from changing the value of the ticks.
Here are some strings containing the format as characters.
| String | Purpose | Example |
|---|---|---|
| yyyy | Four-digit year | 2014 |
| yy | Two-digit year | 14 |
| Quarter of the year using the letter Q and a single number | Q1 | |
| mmmm | Month using full name | September |
| mmm | Three-letter month name | Sep |
| mm | Two-digit month | 09 |
| m | Single-letter month name | S |
| dddd | Day using full name | Monday |
| ddd | Three-letter day name | Mon |
| dd | Two-digit day | 15 |
| d | Single-letter day name | M |
| HH | Two-digit hour | 08 when no AM/PM used, 8 AM otherwise |
| MM | Two-digit minutes | 00 |
| SS | Two-digit seconds | 00 |
| FFF | Three-digit milliseconds | 000 |
| AM or PM | AM or PM is used rather than 24-hour military time | 8:00:00 AM |
You can also use a numeric selection for standardized dates.
| Number | String Format Equivalent | Example |
|---|---|---|
| -1 (default) | ‘dd-mmm-yyyy HH:MM:SS’ or’dd-mmm-yyyy’ (no time output at midnight) | 15-Sep-2014 08:00:00 or15-Sep-2014 |
| 0 | ‘dd-mmm-yyyy HH:MM:SS’ | 15-Sep-2014 08:00:00 |
| 1 | ‘dd-mmm-yyyy’ | 15-Sep-2014 |
| 2 | ‘mm/dd/yy’ | 09/15/14 |
| 3 | ‘mmm’ | Sep |
| 4 | ‘m’ | S |
| 5 | ‘mm’ | 09 |
| 6 | ‘mm/dd’ | 09/15 |
| 7 | ‘dd’ | 15 |
| 8 | ‘ddd’ | Mon |
| 9 | ‘d’ | M |
| 10 | ‘yyyy’ | 2014 |
| 11 | ‘yy’ | 14 |
| 12 | ‘mmmyy’ | Sep14 |
| 13 | ‘HH:MM:SS’ | 08:00:00 |
| 14 | ‘HH:MM:SS PM’ | 8:00:00 PM |
| 15 | ‘HH:MM’ | 08:00 |
| 16 | ‘HH:MM PM’ | 8:00 PM |
| 17 | ‘QQ-YY’ | Q3-14 |
| 18 | ‘QQ’ | Q3 |
| 19 | ‘dd/mm’ | 15/09 |
| 20 | ‘dd/mm/yy’ | 15/09/14 |
| 21 | ‘mmm.dd,yyyy HH:MM:SS’ | Sep.15,2014 08:00:00 |
| 22 | ‘mmm.dd,yyyy’ | Sep.15,2014 |
| 23 | ‘mm/dd/yyyy’ | 09/15/2014 |
| 24 | ‘dd/mm/yyyy’ | 15/09/2014 |
| 25 | ‘yy/mm/dd’ | 14/09/15 |
| 26 | ‘yyyy/mm/dd’ | 2014/09/15 |
| 27 | ‘QQ-YYYY’ | Q3-2014 |
| 28 | ‘mmmyyyy’ | Sep2014 |
| 29 | ‘yyyy-mm-dd’ (ISO 8601) | 2014-09-15 |
| 30 | ‘yyyymmddTHHMMSS’ (ISO 8601) | 20140915T080000 |
| 31 | ‘yyyy-mm-dd HH:MM:SS’ | 2014-09-15 08:00:00 |
