


Pitfall 1: Changing People is Hard
People analytics can change the entire nature of human resources — and nothing gets people stirred up quite like change. Regardless of the scope of people analytics you are implementing, it’s likely that you’ll encounter some level of difficulty if you are trying change the way people think, the way people make decisions, and the way people do what the they do.You need to proactively build awareness of the benefits of change and address the difficulty of change to try to get everyone pitching in. Otherwise, what starts out as ambivalence can quickly turn into full-blow resistance, leaving your movement toward data-informed decision making in tatters.
Here are some ways you can proactively improve the probability of your success:
- Set up a cross-functional people analytics task force to help you be more aware of the needs of others and create an umbrella of support. Whenever you encounter problems, talk it over at a monthly meeting. Not only will you get valuable input, but you'll also get buy-in.
- Build lasting relationships with IT, data-management, and human resource information technology (HRIT) folks. You need their blessing, their input, their support, and their friendship. As with any important relationship, you usually get out what you put in.
- Get an important project sponsor. When you communicate with others, you can let drop that the head honcho is closely watching the outcome of the project. That tends to get people's attention.
- Three words: communicate, communicate, communicate. It is a good idea to send notes to all stakeholders periodically. Be sure to reinforce the importance of people analytics, revisit the benefits of the project, and give them updates on the project’s status.
The figure illustrates how people analytics joins the four broad people S capabilities (strategy, science, statistics, and systems) to create some new innovation that didn’t exist before. Most companies will start people analytics with strengths in some S and deficiencies in one or more of the others. It is important to recognize that different strengths and deficiencies will produce different blind spots or pitfalls. It is the component that is most deficient that will define the pitfall that will materialize. It is my hope that by clarifying capability-related blind spots below you can avoid these capability-related pitfalls entirely.
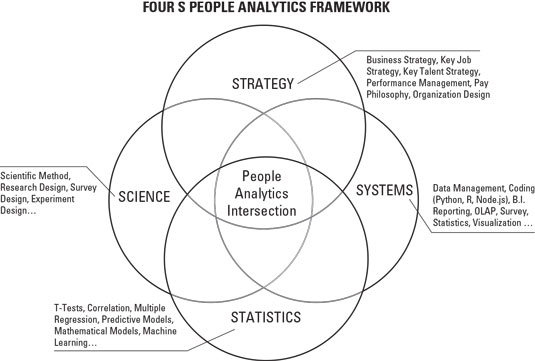 People analytics is the intersection of people strategy, science, statistics and systems.
Pitfall 2: Missing the People Strategy Part of the People Analytics Intersection
People analytics is only really useful if it is aligned to your strategy and informs decision making. Anything else is just going in circles. When data analysis is not linked to strategy or determined by strategy, then the company is wasting time and money in all this activity that is never going to be used.In the absence of a linkage of people analytics to company strategy most companies either attempt to measure everything or measure everything that everyone else is measuring, because they don’t know what else to do.
Pitfall 3: Missing the Statistics Part of the People Analytics intersection
The are many reasons to learn about statistics, but perhaps its most important purpose is to help you make better decisions in a world of much uncertainty. Yes, the world is an uncertain place, but increasingly, the world is also a place overflowing with data. Statistics can help you make sense of data, and in so doing make more sense of the world.People unfamiliar with statistics expect to be able to see clearly the answers to their questions in a line graph or bar chart. However, visual patterns can mislead you. Just because a line seems to increase over time doesn’t mean that your conclusions about why it is increasing are the actual causes. Just because two bars on a graph are different sizes doesn’t mean that the difference is significant or meaningful. Only very large differences among very simple comparisons present themselves obviously in visualizations. Overreliance on visualization leads to simplistic observations that are not up to the task of producing answers to complex questions. The real world is complex: many factors push and pull in different directions at the same time. These don’t translate readily to visualization.
Statistics can be an intimidating subject for many people, but ultimately it’s a subject involving a certain logic and certain procedures that can be learned by anyone. Relationships are much more uncertain, and you manage those every day!
Pitfall 4: Missing the Science Part of the People Analytics Intersection
Popular opinion suggests that knowledge of systems that a company happens to be using (or wants to use) or other technology tools like Python, R or machine learning are the most important skills to look for in analysts hired to lead people analytics initiatives. In my experience, though, nothing could be further from the truth. About the only things in common among the best analysts I’ve met in people analytics are curiosity, imagination, and a knack to get to the heart of problems. Aside from this, I have also noticed that they tend to have studied some form of behavioral science, in particular psychology, sociology, operations science or economics.Science is everywhere in today’s world, so much so now that we hardly notice it. Science has impacted nearly every aspect of our daily lives, from what we eat to how we dress to how we get from point a to point b. Why not the workplace, too? Advances in technology and science are transforming our world at an incredible pace and our children’s future will surely be filled with leaps we can only imagine. No one can escape the significance of science in our world, but not everyone understands the importance of science, has been taught to think critically, or been provided with the tools to analyze and test a problem in the ways people who study science have. The application of science to people at work is a new frontier of science that I’m proud to be a part of, and you can be part of this, too!
The beauty of science is that it's self-correcting. Science is coming up with an idea, testing that idea, and then observing to decide if it works or if you have to throw that idea out. If an idea is wrong, you have to get rid of it to make way for a new one. Science is a way of looking at anything you want to understand and saying how does this work, why does it work, and how can you know about this?
Pitfall 5: Missing the System Part of the People Analytics Intersection
Today it goes without saying that companies have systems supporting the many transactional functions of human resources. You certainly have a system for payroll so you can pay people as well as a human resource information system and some combination of other systems to facilitate all of the specialized activities of human resources, including applicant tracking, performance management, compensation planning, employee relations, learning management, and other specialized operational HR activities or activities facilitated by HR. Systems are almost never the missing ingredient when it comes to HR — the problem is that the systems required for people analytics to operate efficiently are different.The operational systems described in the paragraph above are designed primarily to serve the transactional needs of HR, not the reporting or analysis needs of people analytics. Sure, each system may have a front-end reporting interface to provide access to data in the systems directly; however, these interfaces leave much to be desired. In most cases, the standard reports available from transactional systems are just lists of people or facts and most of the time you have too little control over what goes into those reports. These lists of facts are necessary but not sufficient for the analyses you need. Transactional systems are not designed to perform the core tasks of analytics.
Here are just a few examples of the tasks necessary for analytics that transactional systems are generally not designed to do:
- Provide control over workflow functions like extract, transform, load (ETL) from and to other data environments — how you move data to or from other data sources and join them, in other words.
- Provide control over how you add or remove data elements on a report and how you group data.
- Provide control over what calculations you perform and how you perform calculations.
- Allow you to construct custom datasets to perform statistics operations like correlation, chi-square, multiple regression, t-tests, and so on.
- Provide control of the design of graphs for reports.
- Provide business users a central location for all of the information relevant for them to manage their teams. (Believe me, you don’t want to have to tell business users they have to go to four different systems to pick up data on different topic areas.)
Aside from the sub-HR-function splintering of analytics effort described, many companies are large enough that you also find a splintering of effort between divisions of the company. For example, executives and HR professionals serving the Sales division may acquire their own analysts and the Research & Development division may form another. At another company, the split may be by geography or by business line. At a very large, complex company, the splits may be all of the above and more.
The splintering of analytics activity leads to a number of duplicative tasks being performed in different places of the company without awareness of the work being performed by others. Often the same tasks are repeated by different people that could be more efficiently handled in one common data environment and then split out for their needs or modification. Inefficiency is the problem you find if you have missed the systems part of the four S’s of people analytics.
More importantly, the problems you're trying to understand and resolve with data may actually cross functional or divisional boundaries — the splintering makes it so that you cannot see the insights that cross functional boundaries. Inevitably, problems may be resolved in one part of the company and just pushed to another or a solution may remain elusive to you forever because you're not able to bring a more universal data perspective together.
People analytics can be cobbled together and performed using borrowed systems and scraps of data; however, this can only be a short-term solution. If you have a lot of people performing a lot of tasks on data in an inefficient (and overall ineffective) manner, your chances of long-term success are slim. United you stand, divided you fall. This is why you should try to get your systems house in order by creating a centralized people analytics data environment that brings together multiple data sub-domains and data management functions into one common area.
Pitfall 6: Not Involving Other People in the Right Ways
What if you built a data dashboard and nobody showed up to use it? The users are what will make your data dashboard a success or failure. There are lots of reasons why users may not flock to the tools you roll out. First and foremost, if the data dashboard doesn’t add value to their job, they won’t use it; it may be as simple as that. It also may be that they access the information from time to time but not on a regular basis — they don’t log into the system frequently enough to remember how it could be helpful to them or be comfortable operating in that environment to enjoy it.Rather than start with data that may or may not have any value, start by getting away from your desk to understand better the world of the people you support. Ask questions about production, sales, and other processes. To help other people, you need to understand what those people do, what their pain points are, and what success looks like to them. Armed with that information, you can connect them with an analysis or a report to help them do what they do better.
While it is good to meet with end users early in the process, at the same time you must realize that you can’t expect people to be able to translate their needs to you into the language of dashboard and analysis design. You should not simply walk in and ask them what they want to see on a dashboard. More often than not, they'll simply describe something they have seen before. Unfortunately, this may not be the best report or analysis to help them solve their problem — and you won’t find this out until you build what they asked for and discover they aren’t using it. Contemplating what went wrong you may think, “but this is what they asked me for.” Absent a deliberate strategy of interaction with end users from beginning to end, this disconnect will happen a lot.
People analytics is new. Despite a lot of head nodding, keep in mind that most people don’t know what people analytics is (or is capable of doing), let alone what kind of analysis could help them right now. Figuring out what other people need should be your area of expertise. Your job is not to take specific report and analysis design instructions from them, and their job isn’t to give you specific report and analysis design instruction. Their job is something else. Your job is to elicit from them an understanding of what their job is and what business problems they are solving right now and then design a reporting or analysis solution that will help them do it better.
After you have met with people to talk about what they do, the next thing you should do is create a prototype data analytics solution. In this context, a prototype is a subset of the total solution, where the scope is narrowed down to a few of the most important data elements and/or company segments. At its core, a prototype usually consists of a limited dashboard or analysis solution combined with a stripped-down version of one or more end-user tools that visualize the data. A prototype is a great way to get a reaction, flush out uncertainties, model the challenges that will be found in working with a particular dataset at full-scale implementation, and get people involved along the way for what’s ahead.Pitfall 7: Underfunding People Analytics
If your hired to head up people analytics and find out you have no budget, don’t feel bad. You aren’t the first, and you won’t be the last. Whether it makes sense to quit now or ride it out and fail later depends on your own personal circumstances. One thing is certain: if you don’t communicate clearly and honestly about the level of expectations others have for what they hope to achieve from people analytics versus the level of support and resources provided to you to achieve those results, then your efforts will fail.Full-time people analytics professionals have a notoriously high incidence of burn out because people analytics crosses every department in the company, every sub-function of HR (Recruiting, Compensation, Benefits, Payroll, Employee Relations, Learning & Development, Organization Design, Diversity, and so on) and requires data from many different systems (ATS, HRIS, Compensation Planning, Performance Management, and more). Before you know it, you’re getting requests from the chief human resources officer, division vice presidents, mid-level managers, head of HR sub functions, and people you haven’t even heard of before.
If you can’t get resources to build a scalable data environment and you can’t keep up with report demand, then something is clearly out of whack. Obviously what you are doing must be important or you wouldn’t be getting hit with all these report requests, and yet how then can it not be important enough to invest in the proper data, systems, and support? I have always felt that having too many people coming to you for reports is a better problem to have then not having any, but that being said you will need to navigate this situation carefully or you might just end up going under.
Don’t let enthusiasm for the work of people analytics get in the way of making rational decisions about what you can reasonably deliver. It is a natural tendency to get excited that others are asking for your help and say yes to everything. Resist this tendency. You should think long and hard before you take on a project. Here are some considerations:
- Does this project offer enough business value to justify the effort?
- Are you considering the relative value of this project to other projects that will inevitably receive less of your time and attention if you take on the new project?
- Do you truly have what you need to be successful for this new project?
- What is the person asking for the analysis or report from you willing to do to help you be successful?
- Be blunt about the time and resource realities you face.
- Create a transparent prioritization system. Point to this. Use it.
- Request that the people who need something from you do something for you, too. This could be as simple as becoming an advocate for people analytics and you in the company or it could involve them becoming a project sponsor or member of the people analytics task force. Whatever it is, make sure they pay you back.
Pitfall 8: Garbage In, Garbage Out
Garbage in, garbage out (GIGO) describes the concept that flawed input data produces flawed output or “garbage”. If you have questionable data feeding into your dashboards and analysis, then their output won’t be worth a pile of rotten tomatoes.If there were ever a poster child for a garbage-in-garbage-out statement, it’s the realm of HR data. Data quality is an ongoing problem in all analytics but especially when there’s people data involved. People and their reporting relationships are in a constant state of change; so are the data entities that represent them. That can create confusion and headaches.
For example, if you implement a data dashboard to work with the latest organization hierarchy definition, what will happen when you need to look at historical records when the company had a different organization hierarchy structure? Nothing can destroy the credibility of a reporting or analysis initiative faster than not being able to explain the numbers you get back.
Source data is not a fix-it-and-forget element. Managerial and organizational changes are not just a problem in past data. Organizational changes are constantly happening, so you have to continue to be on the lookout for changes that are occurring anywhere in the company: reorganizations, manager changes, acquisitions, divestitures, and name changes can happen at any time. How do you recognize when you are getting bad results? And if you do recognize a problem, can you trace it to its source? Imagine if one of the operational data sources feeding your data environment breaks and a field that your extract, transform and load (ETL) process uses as a primary key fails to come through. Suddenly everything is wrong on downstream reports. If there is no data check alert designed in the data process, you’ll have no way of knowing that this problem is happening until someone opens up a report in a meeting and says, “this is wrong”. A meeting is not a place where anyone wants to find a problem they can’t explain.
You might be surprised to learn this, but most executives only know the units they manage. This means they have no visibility into the complexities of the company beyond their bailiwick and no awareness of the history of changes across the units of the company for which they do not have direct responsibility. It may be that nobody before you has attempted to report on all of the units of the company as a complete, coherent picture over time. You also may find that some divisions define organization units by manager, some by financial cost centers, others by location, and others by something else entirely. You have to facilitate agreement on a method of arranging organizational structure to report on the company and its many pieces that represents how the company really operates, but that also maintains data integrity and efficient data processing as a whole.
On top of the problem of complexity and change endemic to people you also have to deal with HR system complexity. Most companies use different systems for applicant tracking, human resource information systems, performance management, compensation planning, and other transactional human resource management needs. Even if all of those transactions are performed in one system, you still likely have several payroll and benefits partners, with each one also having their own systems to contend with. Different system owners apply different business rules and often show no interest in maintaining data entry and corrections for data elements they have little need for. Since their job is transactions, they are on to the next transaction — they could not care less about the data for transactions they have completed in the past.Piecing together the data picture as a whole — gathering the entirety of current business rules and naming conventions — is a challenging exercise. In facing this challenge, I offer the following three pieces of advice:
- Pick a topic that really matters and start slowly. Make sure you can do a few things well before you sign up to do more things.
- Plan ahead for confusion and change by creating visibility and flexibility in your master set of metric definitions, data hierarchies, and data relationships.
- Whenever planning for a project, you need to include time to audit, analyze, and (if necessary) fix the data at the source if at all possible.
Pitfall 9: Skimping on New Data Development
Data is the lifeblood of people analytics. Transactional HR systems are designed to speed up operational HR processes; if they produce data on the side, that is more or less accidental. Data from transactional systems is necessary for people analytics, but data produced by these transactions is limited to only a certain range of insights. Failing to understand this fact will limit the value you can derive from people analytics. Here are a few tips that will help you create new data to crank out new insights.- Budget for new data development. Neither HR or IT (or even specialized Analytics departments) do a good job at budgeting for investment in collecting new data or in acquiring subscriptions to new external data sources. Consider having a slice of your budget set aside just for new data development. You might include sending people to conferences to look for ideas for new data sources or interview other people working in the field of people analytics about the data that have proved most valuable to them. In any event, make sure you have a budget — and use it.
- Never miss a chance to get important new data. Creating data is something to keep in the back of your mind at all times. Because there are so many different ways to approach this, all I can do is throw out some examples. If you interview candidates and make some decisions about them, why not record this information in a structured way so that, over the long term, it can be analyzed as well? If you have a new hire fill out a form for some information required by rule or law, why not also collect a few pieces of information that will be valuable to you for analysis reasons? If it takes them only 30 seconds longer to provide you with a few additional details and they already had to stop what they were doing to meet the regulations, then why not? You have employee addresses for other reasons, so why not use this data in conjunction with a public data source to calculate commute time? Speaking of public data, did you know that the U.S. Department of Labor maintains a database of the number of people in a particular zip code by job classification, by ethnicity, by gender and so on? You may talk about diversity, but do you really know if the percentage of people you hire by job classification is proportional to what you can expect in the population? Did you even know that the data you need to answer this question exists? When you deliberately think about the types of data you can use in people analytics, you will find there is an endless variety of surveys, personality inventories, tests, subscription benchmark data sources, and so on, which represent new data sources that can augment your existing people analytics efforts to produce new insights.
- Reinvest time. By tradition or lack of imagination, most people analytics capabilities are focused on producing more efficient outputs. For example, data warehousing tools, data management tools, and data visualization tools are all geared towards more efficiently producing insights that people have previously produced manually in rudimentary applications like Excel. The movement to more scalable and efficient analytics systems is valuable in itself, but it cannot by itself produce new insights if it is simply answering the same questions with the same data. I suggest you take some of the time or money saved by moving to more efficient tools and set it aside for new data development. Simply look at the time people used to spend in Excel before implementing the new automated reporting environment for the same metrics. Allocate some of the time or money saved to obtain or design new data collection instruments that can produce new metrics. Deliberately putting time and money into developing new data sources to go into your people analytics effort will drive more value out of your people analytics effort in the end.
Pitfall 10: Not Getting Started at All
The list of possible pitfalls for people analytics is long, as is the list of excuses used to not getting started.Anything worth doing requires hard work and carries a certain amount of risk. What you have to decide is whether you believe that your company can make better people-related decisions continuing with the old way or whether trying to make things better with data is more likely to give you predictable, repeatable successes.
The reality is that both options come with pitfalls and risk. Regardless of whether you choose to use or ignore data in your decision making, your company can’t avoid making decisions. The part you can control is how well you equip yourself to make good ones. People analytics will serve you well, but to do so you must get started. So, get to it!
