


When you are approaching your stock charts, there are certain attributes you should pay close attention to. The first group of settings includes the time period for each bar, the dates you would like to see, and the spacing.
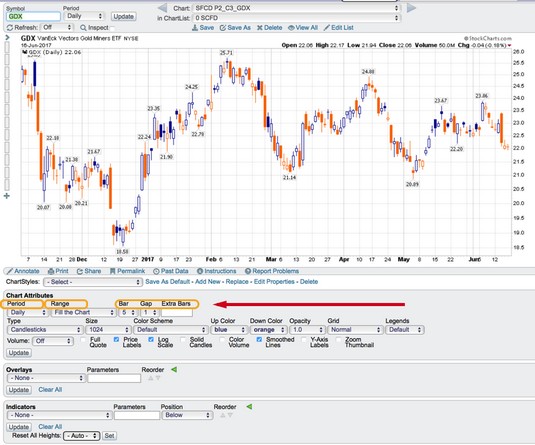 Chart courtesy of StockCharts.com
Period, range, and spacing selections.
Period
When it comes to charts, the most popular time period for investors and swing traders is daily. This means that price information will be for one day. You can see how to set the periods below. Common time period choices include- Monthly
- Weekly
- Daily
- 1 Hour
- 5 Minutes
- 1 Minute
Chart courtesy of StockCharts.comPeriod, range, and spacing selections.
Range
Range displays how many periods you want to display, which is an important choice depending on the information you seek. Stock charts show quickly, without a lot of description, where price has been for a particular period of time. When you set the range, you know the stock’s movement for that period of time.Some default range settings are
- 1 day
- 5 days
- 10 days
- 1 month (roughly 22 trading days)
- 3 months (25 percent of a year, 63 trading days)
- 6 months (50 percent of a year, 129 trading days)
- 12 months (one year, 258 trading days)
- 3 years
- 5 years
- 10 years
- Year to Date
- Select Start/End Date
- Fill the Chart
- Short-term traders select a three-month time frame most often, because they plan to exit in the same day or within a few days. The three-month time frame gives them enough information to see the trend visually, but not too much information that can make it difficult to see an exit point. These charts can be intraday to describe what is happening for the day. Using a chart with five to ten days broken into one-hour candles can show a stock starting to improve or break down.
- Investors are less concerned with intraday movements and tend to select a one-year chart so they can catch longer trends. Because they will likely hold a stock for months or years, investors want to see how the stock has done over many years rather than just a few months. When they are trying to pick an entry or exit point, long-term investors will look to monthly charts.
- Institutional investors tend to use 20-year charts with monthly time frames, but they will look at many different time frames as they make decisions for their portfolios.
The range selection has a relationship with the individual time period. Chart users will want to pair enough data to see the trend that gives them the ability to see the most recent information clearly.
Bar, gap, and extra bars
This area of the chart attributes changes automatically on StockCharts.com depending on which range you use. Set the range to Fill the Chart, so the software will calculate settings using three components. The software uses the width of each daily price bar, the space between the bars (gap), and the extra bars setting to pick the number of days to display. When you get more expertise, you may want to do your own fills, but that’s more complicated than you need to get right now. Above, the width of each bar is 5, and the space between the bars (the gap) is 1.The extra bars setting is a hidden gem. This setting allows white space on the right-hand side of the chart so the last price bar is not pushed up against the side of the chart. Typically, an extra bars setting may be 5 or 10 bars. You can set this manually by putting the number of extra bars in the Extra Bars box.
