


Histograms are bar charts that show what fraction of the subjects have values falling within specified intervals. The main purpose of a histogram is to show you how the values of a numerical value are distributed. This distribution is an approximation of the true population frequency distribution for that variable.
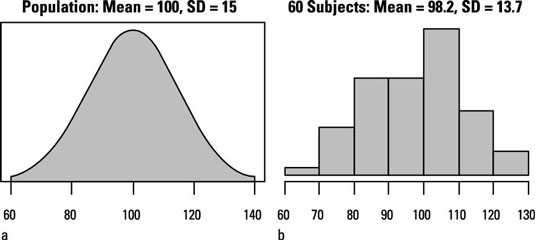
The smooth curve shows how IQ values are distributed in an infinitely large population. The height of the curve at any IQ value is proportional to the fraction of the population in the immediate vicinity of that IQ. This curve has the typical “bell” shape of a normal distribution.
The histogram indicates how the IQs of 60 subjects randomly sampled from the population might be distributed. Each bar represents an interval of IQ values with a width of ten IQ points, and the height of each bar is proportional to the number of subjects in the sample whose IQ fell within that interval.
Log-normal distributions
Because a sample is only an imperfect representation the population, determining the precise shape of a distribution can be difficult unless your sample size is very large. Nevertheless, a histogram usually helps you spot skewed data.
A skewed shape is typical of a log-normal distribution, which occurs very often in biological work. It’s called log-normal because if you take the logarithm of each data value (it doesn’t matter what kind of logarithm you take), the resulting logs will have a normal distribution.
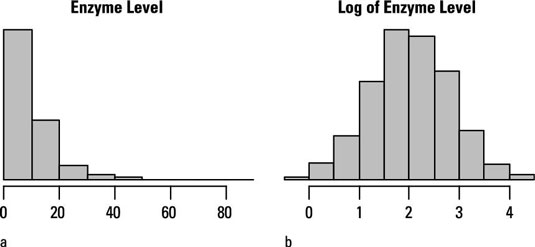
So it’s good practice to prepare a histogram for every numerical variable you plan to analyze, to see whether it’s noticeably skewed and, if so, whether a logarithmic “transformation” makes the distribution more nearly normal.
Other abnormal distributions
Log-normality isn’t the only kind of non-normality that can arise in real-world data. Depending on the underlying process that gives rise to the data, the numbers can be distributed in other ways.
For example, event counts often behave according to the Poisson distribution and can be, at least approximately, normalized by taking the square root of each count (instead of the logarithm, as you do for log-normal data). Still other processes can give rise to left-skewed data or to data with two (or more) peaks.
What if neither the log-normal nor the square-root transformation normalizes your skewed data? One approach is to use the Box-Cox transformation, which has this general formula: Transformed X = (XA – 1)/A, where A is an adjustable parameter that you can vary from negative to positive values.
Depending on the value of A, this transformation can often make left-skewed or right-skewed data more symmetrical (and more normally distributed). The figure shows how the Box-Cox transformation can help normalize skewed data.
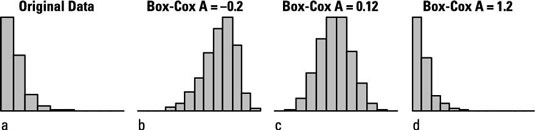
Some software lets you vary A through a range of positive or negative values using a slider on the screen that you can move with your mouse. As you slide the A value back and forth, you see the histogram change its shape from left-skewed to symmetrical to right-skewed. Here, using A = 0.12 normalizes the data quite well.
When A is exactly 0, the Box-Cox formula becomes 0/0, which is indeterminate. But it can be shown that as A approaches 0 (either from the positive or negative side), the Box-Cox formula becomes the same as the logarithm function. So the logarithmic transformation is just a special case of the more general Box-Cox transformation.
If you can’t find any transformation that makes your data look even approximately normal, then you have to analyze your data using nonparametric methods, which don’t assume that your data is normally distributed.
