


Follow these steps:
-
Draw a picture of the normal distribution.
-
Translate the problem into one of the following: p(X < a), p(X > b), or p(a < X < b). Shade in the area on your picture.
-
Standardize a (and/or b) to a z-score using the z-formula:

-
Look up the z-score on the Z-table (see below) and find its corresponding probability.
a. Find the row of the table corresponding to the leading digit (ones digit) and first digit after the decimal point (the tenths digit).
b. Find the column corresponding to the second digit after the decimal point (the hundredths digit).
c. Intersect the row and column from Steps (a) and (b).
-
If you need a "less-than" probability — that is, p(X < a) — you're done.
-
If you want a "greater-than" probability — that is, p(X > b) — take one minus the result from Step 4.
-
If you need a "between-two-values" probability — that is, p(a < X < b) — do Steps 1–4 for b (the larger of the two values) and again for a (the smaller of the two values), and subtract the results.
The probability that X is equal to any single value is 0 for any continuous random variable (like the normal). That's because continuous random variables consider probability as being area under the curve, and there's no area under a curve at one single point. This isn't true of discrete random variables.
Suppose, for example, that you enter a fishing contest. The contest takes place in a pond where the fish lengths have a normal distribution with mean μ = 16 and standard deviation σ = 4-
Problem 1: What's the chance of catching a small fish — say, less than 8 inches?
-
Problem 2: Suppose a prize is offered for any fish over 24 inches. What's the chance of winning a prize?
-
Problem 3: What's the chance of catching a fish between 16 and 24 inches?

Next, translate each problem into probability notation. Problem 1 is really asking you to find p(X < 8). For Problem 2, you want p(X > 24). And Problem 3 is looking for p(16 < X < 24).
Step 3 says change the x-values to z-values using the z-formula:
![]()
For Problem 1 of the fish example, you have the following:

Similarly for Problem 2, p(X > 24) becomes
![]()
And Problem 3 translates from p(16 < X < 24) to
![]()
The following figure shows a comparison of the X-distribution and Z-distribution for the values x = 8, 16, and 24, which standardize to z = –2, 0, and +2, respectively.


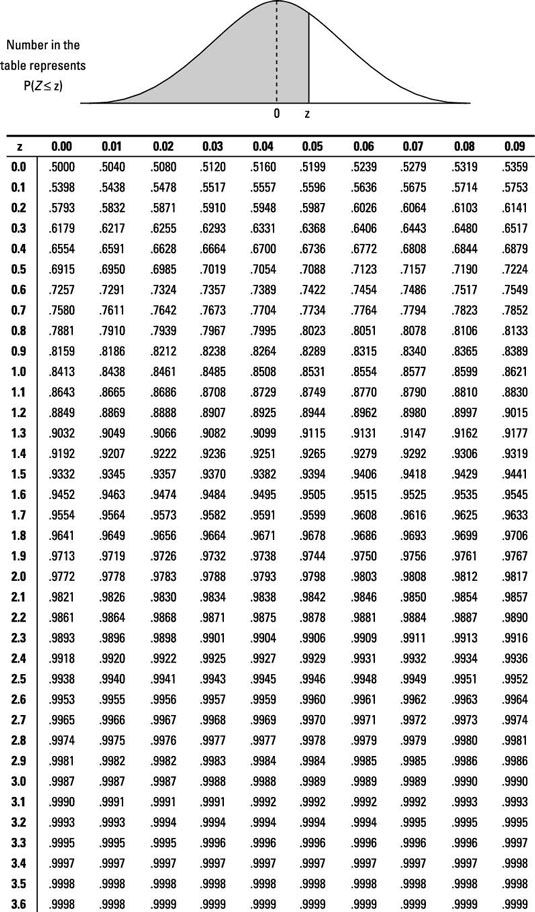
In Problem 1 of the fish example, you want p(Z < –2); go to the Z-table and look at the row for –2.0 and the column for 0.00, intersect them, and you find 0.0228 — according to Step 6, you're done. The probability of a fish being less than 8 inches is equal to 0.0228.
For Problem 2, find p(Z > 2.00). Because it's a "greater-than" problem, this calls for Step 7. To be able to use the Z-table, you need to rewrite this in terms of a "less-than" statement. Because the entire probability for the Z-distribution equals 1, you know p(Z > 2.00) = 1 – p(Z < 2.00) = 1 – 0.9772 = 0.0228 (using the Z-table). So, the probability that a fish is greater than 24 inches is also 0.0228. (Note: The answers to Problems 1 and 2 are the same because the Z-distribution is symmetric; refer to the first figure.)
In Problem 3, you find p(0 < Z < 2.00); this requires Step 8. First find p(Z < 2.00), which is 0.9772 from the Z-table. Then find p(Z < 0), which is 0.5000 from the Z-table. Subtract them to get 0.9772 – 0.5000 = 0.4772. The probability of a fish being between 16 and 24 inches is 0.4772.
The Z-table does not list every possible value of Z; it just carries them out to two digits after the decimal point. Use the one closest to the one you need. And just like in an airplane where the closest exit may be behind you, the closest z-value may be the one that is lower than the one you need.
