


Most hypothesis tests use a similar framework, whether you are testing one population mean or the difference between two population means, some patterns will develop, but each hypothesis test has its own special elements.
Sample questions
A manager of a large grocery store chain believes that happy employees are more productive than unhappy ones. He randomly samples 60 of his grocery checkout clerks and classifies them into one of two groups: those who smile a lot (Group 1) and those who don't (Group 2).
After sorting the random sample, there just happens to be 30 in each group. He then examines their productivity scores (based on how quickly and accurately they're able to assist customers) and gets the following data for each group:
Group 1 score mean: 33.3
Group 2 score mean: 14.4
The population of productivity scores is normally distributed with a standard deviation of 17.32, which is assumed to be the population standard deviation that applies both to Group 1 and Group 2.
Conduct an appropriate test to see whether a difference in productivity levels exists between the two groups among all employees, using
What are the appropriate null and alternative hypotheses for this test?
Answer:


The null hypothesis is always a statement of equality. The alternative in this case is that the population mean of Group 1 will be larger than that of Group 2.
What is the critical value for a z-test for this hypothesis?
Answer: 1.645
First, determine whether a z-test for independent groups is appropriate. Because the population of scores is normally distributed and you have population standard deviation information for both groups, you can proceed to do the test.
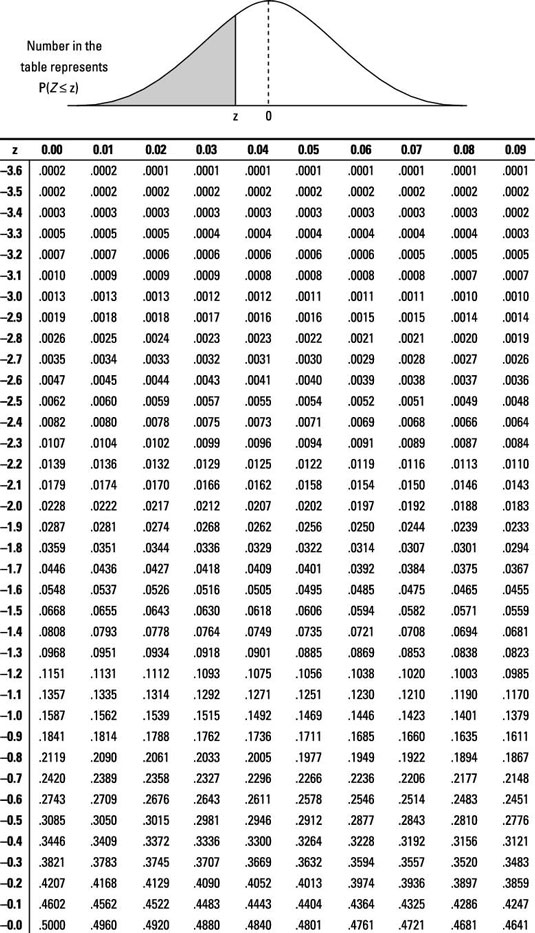
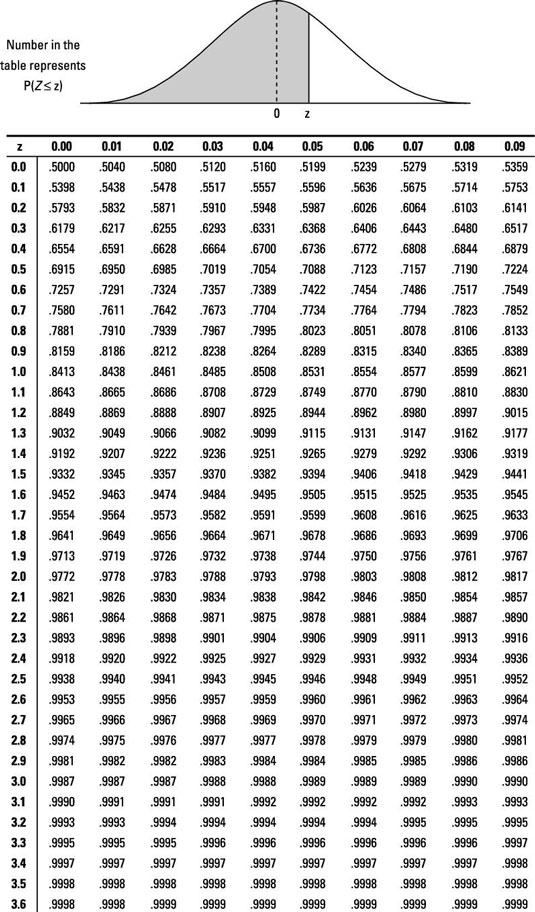
This is a greater than alternative hypothesis with an alpha level of 0.05. Using the Z-table, find the critical value of z such that 0.05 of the probability lies above it. This value falls between 1.64 and 1.65 and just happens to round to 1.645.
What is the standard error for this test?
Answer: 4.472
To calculate the standard error, use this formula:

So for this test, the standard error is

If you need more practice on this and other topics from your statistics course, visit 1,001 Statistics Practice Problems For Dummies to purchase online access to 1,001 statistics practice problems! We can help you track your performance, see where you need to study, and create customized problem sets to master your stats skills.
