


As with single-variable data sets, on the TI-Nspire you can plot a value on a scatter plot that is displayed as a vertical line perpendicular to the x-axis at a point equal to the specified value. To access the Plot Value feature, press [MENU]→Analyze→Plot Value. At the prompt, type the value (or expression that yields a numerical value) and press [ENTER] to draw the vertical line associated with the value.
You can plot a single number or an expression that equals a number. Statistical values such as mean or standard deviation are good choices for the Plot Value feature.
To remove a plotted value, move the cursor over the vertical line and right-click ([CTRL][MENU]); then choose Remove Plotted Value (or [CLICK][DEL]).
Sometimes, the best fit for data is an exponential function. To graph a function, press [MENU]→Analyze→Plot Function. Enter the function at the prompt, and press [ENTER] to view the graph.
How to add a slider to a graph on TI-Nspire
To get really fancy, try adding sliders to your graph (press [MENU]→Actions→Insert Slider). In the first screen, two minimized sliders are created, one to manipulate the value of a in the function y = abxand one to manipulate the value of b in the function y = abx.
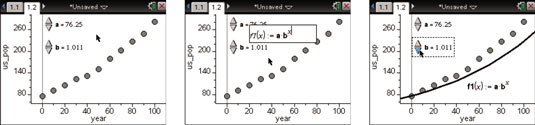
In the second screen, the Plot Function tool is opened and the function a@@dmsbx was typed at the prompt. The boldface letters indicate stored variables defined in the sliders. The third screen shows an attempt to get a nice match for the data set.
How to shade under a function on TI-Nspire
Press [MENU]→Analyze→Shade Under Function to shade under a function. Then follow these steps:
Move the cursor to a desired location and press [CLICK] to set the left bound of the shaded region.
Observe the dotted line and the number indicating the current x-value.
Move the cursor to a desired location and press [CLICK] to set the right bound of the shaded region.
A shaded region appears along with a number representing the area of the region.
Click and drag the left or right side of the shaded region to change the endpoints.

