The HTML5
value: The current measured value for your meter
high: States a value considered to be high for readings on this meter
low: States a value considered to be low for readings on this meter
max: Sets the upper bound for readings on this meter and its display
min: Sets the lower bound for readings on this meter and its display
optimum: States a value considered to be optimal for readings on this meter
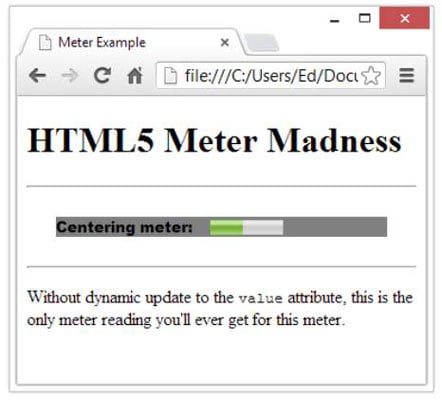
Here’s a fully tricked-out markup example, shown in the figure displayed in Chrome:
<meter high="90" low="10" max="100" min="0" optimum="50"
 value="44">Center-seeking meter</meter>
The figure shows the meter in the context of a complete HTML file, with some use of CSS to set off the meter display. The meter’s current value falls just below the optimal halfway mark.
The high, low, and optimum attributes as well as the text enclosed between the opening
To see and play around with meter markup (and value settings), visit Quackit.com.
For a nice demo of a meter at work (as you type into a text box, the character count goes up and the green meter bar gets longer), visit JSFIDDLE.
The following is a snippet of HTML markup that shows three different meter bars: one for storage space consumption, one for voter turnout, and one for tickets sold. Don’t scratch your head too much about it: It’s just a contrived example.
<p>Storage space usage: <meter value="6" max="8">6 blocks used
   (out of 8 total)</meter> </p>
<p>Voter turnout:
  <meter value="0.75"><img alt="75%" src="graph75.png"></meter></p>
<p>Tickets sold: <meter min="0" max="100" value="75"></meter></p>