You’ll need to determine whether your data set requires data cleansing. In that case, you’ll utilize Tableau Prep. If you want to collaborate and share your data, reports, and visualizations, you’ll use either Tableau Cloud or Tableau Server.
Central to the Tableau solution suite is Tableau Desktop; it’s at the heart of the creative engine for virtually all users at some point in time to create visualization renderings from workbooks, dashboards, and stories.
Keep reading for tips about data layout and cleansing data in Tableau Prep.
Selecting the right Tableau application
To suit your business objective, you have nine different applications of Tableau to choose from. Although Tableau Desktop, Tableau Prep Builder, and Tableau Cloud form the core of the Tableau offerings, that doesn’t mean that the other applications aren’t important. Each has its place in the Tableau Business Intelligence ecosystem. The following list describes the merit of each product:
- Tableau Desktop is the cornerstone product of the suite, offering data visualization and analysis. It allows users to create interactive visualizations, dashboards, and reports by connecting to and analyzing data from various sources, including spreadsheets, databases, and cloud services.
- Tableau Prep helps the analyst prepare, clean, and shape data for analysis and visualization using a visual, user-friendly interface.
- Tableau Cloud is the cloud-based platform for data analytics and visualization management post-publishing in Tableau Desktop and hosted by Tableau. The platform allows users to store, share, and collaborate using Tableau workbooks, data sources, and dashboards in a secure, web-based environment.
- Tableau Server is a business intelligence and analytics platform hosted by an enterprise organization that allows users to publish, share, and collaborate on interactive dashboards, reports, and visualizations much like those in Tableau Cloud. The big difference with this platform is that the organization is responsible for the infrastructure, not Tableau.
- Tableau Public is the public platform for sharing data visualization and analysis assets developed by Tableau users online. Although Tableau Cloud or Tableau Server controls assets based on permissions, there are no permissions allowed with Tableau Public All the work created in Tableau Public is fully exposed for any user to consume, including the datasets, reports, dashboards, and visualizations.
- CRM Analytics is the former Salesforce Einstein Analytics product. The platform developed by Salesforce integrates CRM Analytics data to visualize and analyze data, leveraging artificial intelligence.
- Data Management is a collection of tools that help organizations prepare their data for analysis. The collection includes Tableau Prep, Tableau Catalog, and Tableau Server Management Add-Ons. Data Management is limited in functionality for Tableau Cloud.
- Embedded Analytics enables end users to embed Tableau visualizations and interactive dashboards into their own applications and websites. You’ll need to utilize a variety of APIs, SDKs, and web connectors to enable the visualizations to support a complete user experience.
- Advanced Management is a compilation of add-on features included across the products, such as advanced analytics models, data science integrations, governance and security support, and scalability and performance enhancements. Depending on your version of Tableau, one or more of these features can be accessed.
Understanding data layout in Tableau
When you’re trying to craft your visualizations in Tableau, you’ll become very familiar with the green and blue pill. The pill is a visual representation of data, either a discrete or continuous measure (quantitative data) or discrete or continuous dimension (qualitative data).
Here are some key rules when placing the pills on the Tableau shelves in Tableau Desktop:
- Dimensions generally turn into blue pills.
- Measures, a numeric value, are considered continuous in nature.
- Measures oftentimes turn into green pills.
When you’re looking at a Tableau visualization, continuous variables take on any value with a range of values on a continuous scale. The range of values may even have decimals or fractional values. Examples include age, weight, temperature, salary, or height.
Continuous variables in Tableau are typically displayed on an axis and can be visualized using line charts, scatter plots, or heat maps. In the following visualization, the dollar amount for the Federal Prison System is an example of a continuous scale.
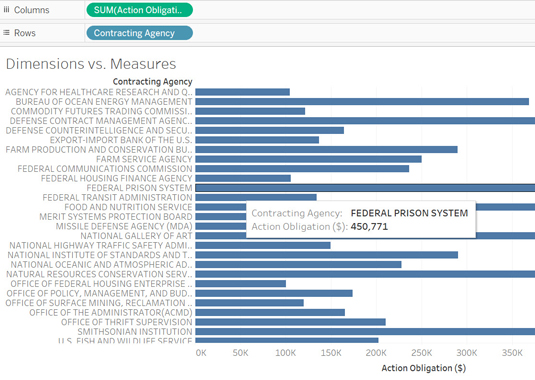
Example of a continuous scale
Discrete variables can take on a limited number of distinct values. Consider discrete variables to be categorical in nature. They can’t take shape with fractions or decimals. Discrete variables include gender, race, city, state, zip codes, and country. Notice a pattern: There is only one option to pick from for each option.
Discrete variables are displayed using bars or targeted points in visualizations such as bar charts, pie charts, or histograms. In the visualization just presented, each federal agency that has received a budget allocation represents a discrete value.
Tips for cleansing data in Tableau prep
Most datasets have flaws. To ensure that your data is presented accurately in a visualization, a prerequisite step involves extracting, transporting, and loading (ETL) the data into Tableau Prep through the Connection pane, shown in the following figure).
After the Connections pane processes the data via import, the table will either appear on the Flow pane (see the figure below), or you must drag one or more tables to the Flow pane. The Flow pane is also referred to as a canvas interchangeably.
You can then add one or more steps to begin cleansing your data by pressing the + sign, also shown in the figure.

The Tableau Flow pane
Common cleansing options available throughout Tableau include:
- Remove duplicates: Select Duplicate Field to remove duplicate rows in your dataset.
- Rename fields: To make your field names more meaningful, you should rename the fields using Tableau Prep by selecting Rename Field.
- Remove null values: Select Filter and then Null Values to eliminate null or missing values from your dataset.
- Split columns: Select Split Values if you need to split a column into multiple columns. For example, there might be multiple values. Or perhaps you want to break up values from A–L and M–Z. Those are classic examples of where using the Split Values option is appropriate.
- Change a data type: Sometimes Tableau doesn’t select the correct data type. For example, a field may be recognized as a string, but all the values are numeric. In that case, you select the Data Type icon in the left corner of each column to change the data type. The icon appears initially as the letters ABC.
- Clean: You may find erroneous characters that appear frequently in a column. Should that be the case, select Clean and then choose among these options that appear: Make Uppercase, Make Lowercase, Remove Numbers, Remove Letters, and Remove Punctuation.
- Filter data: Use the Filter option to remove any unnecessary rows from your data, including selected or wildcard values.
Although there are many other data cleansing options, these are Tableau’s most utilized ones. The image below provides an example of the menu where you can find all these filtering features to begin the data-cleansing journey in Tableau Prep.
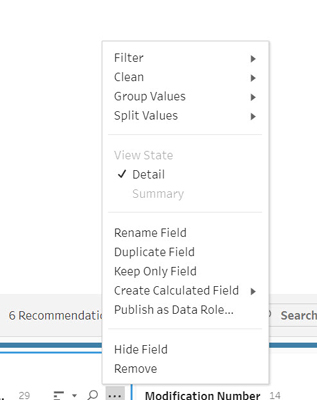
Tableau menu for data cleansing options