


As with any TI-Nspire application, you have the option of launching the Data & Statistics application by inserting a new page and selecting Data & Statistics from the seven available choices.
However, because the purpose of the Data & Statistics application is to graph numerical (and sometimes categorical) data, it makes sense to start with the Lists & Spreadsheet application. Then, use the Quick Graph feature in the Lists & Spreadsheet application to launch the Data & Statistics application.
How to enter data in Lists & Spreadsheet
The rules for using the Lists & Spreadsheet application in conjunction with Data & Statistics are quite straightforward. You must have one or two named lists in the Lists & Spreadsheet application.
For example, look at the lists displayed. In the first screen is a list called dice_sum that uses the command =randint(1,6,50) + randint(1,6,50) to produce a list of 50 numbers. This list represents a simulation of rolling two dice 50 times and recording their sums. This is a single-variable data set because only one list of data is to be analyzed.
The second screen shows the U.S. Immigrant Population versus Year data, which represents a two-variable data set with the independent variable represented by Year and the dependent variable represented by U.S. Immigrant Population.
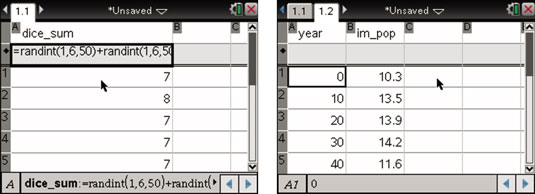
Notice that each list is named. You must have named lists to use the Data & Statistics application.
How to use the Quick Graph feature
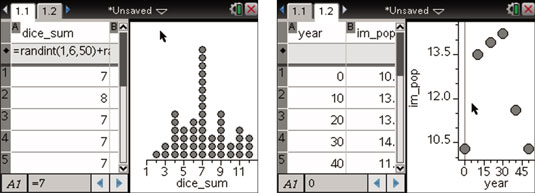
After your named lists are complete, press [MENU]→Data→Quick Graph (or right-click) to open the Quick Graph feature. The first screen shows the result of using Quick Graph with the single-variable data set. TI-Nspire automatically opens a split screen with a Data & Statistics page side by side with the existing Lists & Spreadsheet page.
By default, single-variable data sets are visually represented by a dot plot. TI-Nspire can represent single-variable data sets with a dot plot, box plot, or histogram.
The second screen shows the result of using Quick Graph with the two-variable data set. Again, TI-Nspire automatically opens a split screen with a Data & Statistics page and the existing Lists & Spreadsheet page.
With the Lists & Spreadsheet page active, try pressing [CTRL][R] to recalculate the values dependent on the formula =randint(1,6,50) + randint(1,6,50). This action generates a new set of values, and the dot plot updates accordingly.
If you have two or more columns of data contained in a Lists & Spreadsheet application, you must select the column or columns of data to be used with Quick Graph. Here’s how you accomplish this task:
Select a column. Use the Touchpad to move the cursor to the letter at the top of the column. [CLICK] directly on the letter. For example, click the A to select column A. This is just one of many “clickable areas” on the TI-Nspire.
Select multiple rows or columns. After selecting a column, press and hold the [SHIFT] key. While holding this key, press the Touchpad keys to select additional columns.


