


After you calculate all the asymptotes and the x- and y-intercepts for a rational function, you have all the information you need to start graphing the function. Rational functions with equal degrees in the numerator and denominator behave the way that they do because of limits. What you need to remember is that the horizontal asymptote is the quotient of the leading coefficients of the top and the bottom of the function.
Take a look at
which has equal degrees on the variables for each part of the fraction. Follow these simple steps to graph g(x), which is shown in this figure:
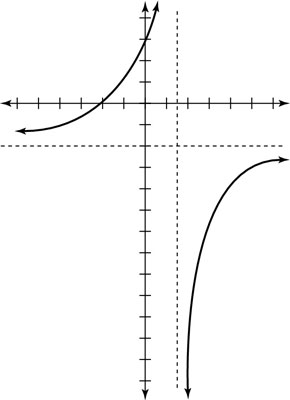
Sketch the vertical asymptote(s) for g(x).
Graphing the vertical asymptote first shows you the number in the domain where your graph can’t pass through. The graph approaches this point but never reaches it. With that in mind, what value(s) for x can you not plug into the rational function?
Set the denominator of the rational function equal to zero.
For g(x), 4 –3x = 0.
Solve this equation for x.
4 – 3x = 0
x = 4/3
You find only one vertical asymptote at x = 4/3, which means you have only two intervals to consider:

Sketch the horizontal asymptote for g(x).
To find a horizontal asymptote of a rational function, you need to look at the degree of the polynomials in the numerator and the denominator. The degree is the highest power of the variable in the polynomial expression.
The function g(x) has equal degrees on top and bottom. To find the horizontal asymptote, divide the leading coefficients on the highest-degree terms:

You now have your horizontal asymptote for g(x). So you can now sketch a horizontal line at that position.
Plot the x- and y-intercepts for g(x).
The final piece of the puzzle is to find the intercepts (where the line or curve crosses the x- and y-axes) of the rational function, if any exist:
To find the y-intercept of an equation, set x = 0. (Plug in 0 wherever you see x.) The y-intercept of g(x), for instance, is:

So the y-intercept of g(x) is 3.
To find the x-intercept of an equation, set y = 0 and solve for x:
For any rational function, the shortcut to finding the x-intercept is to set the numerator equal to zero and then solve. Sometimes when you do this, however, the equation you get is unsolvable, which means that the rational function doesn’t have an x-intercept.

So, g(x) has an x-intercept at –2.
Use test values of your choice to determine whether the graph is above or below the horizontal asymptote.
The two intercepts are already located on the first interval and above the horizontal asymptote, so you know that the graph on that entire interval is above the horizontal asymptote (you can easily see that g(x) can never equal to –2). Now, choose a test value for the second interval greater than 4/3. For example, if you choose x = 2, then substituting this into the function g(x) gives you –12. You know that –12 is way under –2, so you know that the graph lives under the horizontal asymptote in this second interval.


