


Sometimes you will be asked to graph a sine or cosine function with more than one transformation. For example, you may need to change the amplitude of the graph as well as shift it horizontally. When performing multiple transformations, you must do them in this order:
Change the amplitude.
Change the period.
Shift the graph horizontally.
Shift the graph vertically.
The equations that combine all the transformations into one are as follows:
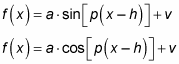
and divide by p to find the period. The variable h is the horizontal shift, and v is the vertical shift.
The most important thing to know is that sometimes a problem is written so that it looks like the period and the horizontal shift are both inside the trig function. For example,
makes it look like the period is twice as fast and the horizontal shift is pi, but that isn't correct. All period shifts must be factored out of the expression to actually be period shifts, which in turn reveals the true horizontal shifts. You need to rewrite f(x) as
This function tells you that the period is twice as fast but that the horizontal shift is actually pi/2 to the right.
Because this concept is so important, you should look at another example to make sure you grasp it. With the following steps, graph
Write the equation in its proper form by factoring out the period constant.
This step gives you

Graph the parent graph.
Graph the original cosine function y = cos x as you know it.
Change the amplitude.
This graph has an amplitude of 3, but the negative sign turns it upside down'. The range is now [–3, 3]. You can see the amplitude change in the figure.
 Changing the amplitude to 3. Since the coefficient is –3, the graph is also turned upside down.
Alter the period.
The constant 1/2 affects the period. Solving the equation

gives you the period of

The graph moves half as fast and finishes at

which you can see in the figure.
 Changing the period to 4pi. One cycle of the graph now goes from x = 0 to x = 4pi.
Shift the graph horizontally.
When you factored out the period constant in Step 1, you discovered that the horizontal shift is to the left

This shift is shown in this figure.
 A horizontal shift to the left. One cycle of the graph now goes from x = –pi/2 to x = (7pi)/2.
Shift the graph vertically.
Because of the – 2 you see in Step 1, this graph moves down two positions, which you can see in this figure.

State the new domain and range.
The functions of sine and cosine are defined for all angles θ. The domain for the sine and cosine functions are all real numbers, or

The range of the graph in the figure has been stretched because of the amplitude change, and shifted down.
To find the range of a function that has been shifted vertically, you add or subtract the vertical shift (–2) from the altered range based on the amplitude. For this problem, the range of the transformed cosine function is [–3 – 2, 3 – 2], or [–5, 1].


