For visual information to be meaningful and more informative, you can use MATLAB to add titles, labels, legends, and other enhancements to plots of any type. Here are some tips for enhancing your plot.
Getting an axes handle
Before you can do anything, you need a handle to the current axes. The best way to obtain such a handle is to type Bar2Axes = gca() (Get Current Axes) and press Enter. The gca() function returns the handle for the current plot. When you type get(Bar2Axes) and press Enter, you see the properties associated with the current plot.
Modifying axes labels
MATLAB automatically creates labels for some of the axes for you. However, the labels are generic and don’t really say anything. To modify anything on the axes, you need an axes handle.
After you have the handle, you use the appropriate properties to modify the appearance of the axes. For example, to modify the x axis label, you type xlabel(Bar2Axes, ‘X Axis’) and press Enter. Similarly, for the y axis, you type ylabel(Bar2Axes, ‘Y Axis’) and press Enter. You can also use the zlabel() function for the z axis.
If you want to assign meaningful names to the x axis ticks, you can type set(Bar2Axes, ‘XTickLabel’, {‘Yesterday’, ‘Today’, ‘Tomorrow’}) and press Enter. Notice that the labels appear within a cell array using curly brackets ({})
Likewise, to set the y axis ticks, you can type set(Bar2Axes, ‘YTickLabel’, {‘Area 1’, ‘Area 2’, ‘Area3’}) and press Enter. You can also use a ZTickLabel property, which you can modify.
To control the tick values, you type set(Bar2Axes, ‘ZTick’, [0, 5, 10, 15, 20, 25, 30, 35, 40]) and press Enter. Those two axes also have XTick and YTick properties. Of course, in order to see the z axis ticks, you also need to change the limit. To perform this task you type set(Bar2Axes, ‘ZLim’, [0 45]) and press Enter.
Many of the set() function commands have alternatives. For example, you can change the ZLim property by using the zlim() function. The alternative command in this case is zlim(Bar2Axes, [0 45]).
Use the get() function whenever necessary to discover additional interesting properties to work with. Properties are available to control every aspect of the axes’ display. For example, if you want to change the color of the axes’ labels, you use the XColor, YColor, and ZColor properties.

Many properties have an automatic setting. For example, to modify the ZLim property so that it uses the automatic setting, you type zlim(Bar2Axes, ‘auto’) and press Enter. The alternative when using a set() function is to type set(Bar2Axes, ‘ZLimMode’, ‘auto’) and press Enter.
You can always change properties using the GUI as well. Click the Edit Plot button to put the figure into edit mode. Click the element you wish to modify to select it. Right-click the selected element and choose Show Property Editor to modify the properties associated with that particular element.
Adding a title
You use the title() function to add a title. However, the title() function accepts all sorts of properties so that you can make the title look precisely the way you want.
To see how this function works, type title(Bar2Axes, ‘Sample Plot’, ‘FontName’, ‘Times’, ‘FontSize’, 22, ‘Color’, [.5, 0, .5], ‘BackgroundColor’, [1, 1, 1], ‘EdgeColor’, [0, 0, 0], ‘LineWidth’, 2, ‘Margin’, 4) and press Enter. MATLAB changes the title.
Here’s a list of the properties you just changed:
FontName
FontSize
Color
BackgroundColor
EdgeColor
LineWidth
Margin
Rotating label text
In some cases, the text added to a plot just doesn’t look right because it doesn’t quite reflect the orientation of the plot itself. You can modify them so that they look better.
When you review some properties using the get() function, you see a handle value instead of an actual value. For example, when you look at the XLabel value, you see a handle that lets you work more intimately with the underlying label. To see this value, you use the get(Bar2Axes, ‘XLabel’) command.
If you don’t want to use a variable to hold the handle, you can see the XLabel properties by typing get(get(Bar2Axes, ‘XLabel’)) and pressing Enter. What you’re telling MATLAB to do is to get the properties that are pointed to by the XLabel value obtained with the Bar2Axes handle — essentially, a handle within a handle.
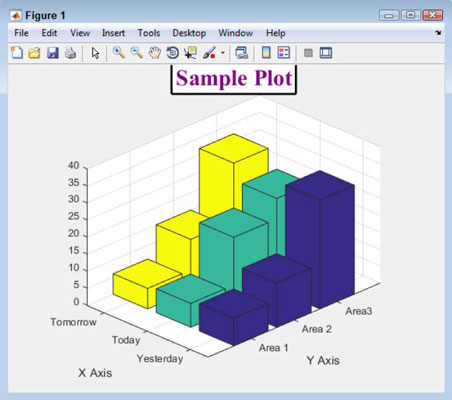
One of the properties within XLabel is Rotation, which controls the angle at which the text is displayed. To change how the plot looks, type set(get(Bar2Axes, ‘XLabel’), ‘Rotation’, -30) and press Enter. You can do the same thing with the y axis label by typing set(get(Bar2Axes, ‘YLabel’), ‘Rotation’, 30) and pressing Enter.
The Position property allows you to reposition labels. To see the starting position of the x axis label, type get(get(Bar2Axes, ‘XLabel’), ‘Position’) and press Enter. The example setup shows the following output:
ans =
 1.4680 -1.3631   0
Small tweaks work best. Type set(get(Bar2Axes, ‘XLabel’), ‘Position’, [1.50 -1.3 1]) and press Enter to better position the x axis label. After a little fiddling, your X Axis label should look like this.

Employing annotations
Annotations let you add additional information to a plot. You have access to these drawing elements:
Line
Arrow
Text Arrow
Double Arrow
Textbox
Rectangle
Ellipse
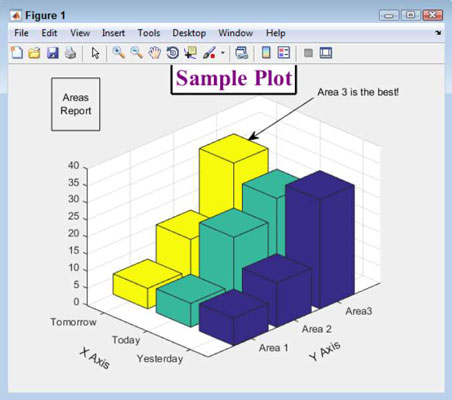
To add annotations, you use the annotation() function. Say you want to point out that Area 3 is the best area of the group. To add the text area, you type TArrow = annotation(‘textarrow’, [.7, .55], [.9, .77], ‘String’, ‘Area 3 is the best!’) and press Enter.

The annotations don’t all use precisely the same command format. For example, when you want to add a textbox, you provide the starting location, height, and width, all within the same vector. To see this version of the annotation() function in action, type TBox = annotation(‘textbox’, [.1, .8, .11, .16], ‘String’, ‘Areas Report’, ‘HorizontalAlignment’, ‘center’, ‘VerticalAlignment’, ‘middle’) and press Enter.