


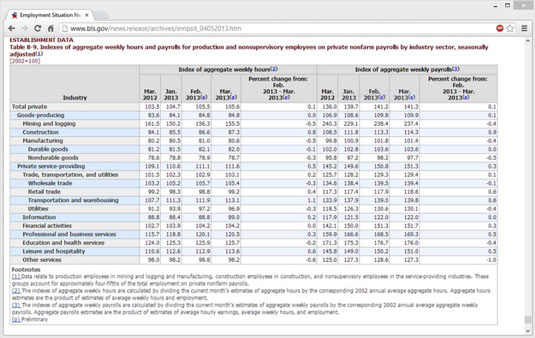
For this table-construction exercise, you’re going to draw some data from the hard-working economists and statisticians at the U.S. Bureau of Labor Statistics. On the website, scroll down to Table B-9: Indexes of Aggregate Weekly Hours and Payroll, shown in this figure. (The figure no-doubt shows teeny-tiny type, but it should nonetheless give you some idea of what you’re looking for.)
As you examine Table B-9, here’s what you see:
The caption at the top is a sort of rust color and begins with ESTABLISHMENT DATA Table B-9: Indexes of Aggregate. . . . This kind of information is just what the caption element is intended to capture and deliver.
Below the caption is a set of table headings — a table header, in other words — with a light gray background and various column headings. At the left is a list of industries. Then the table has two sets of columns (labeled Index of Aggregate Weekly Hours and Index of Aggregate Weekly Payrolls), each with four columns of dates and a Percent Change column from February to March 2013.
The table body starts with text that reads Total Private and continues down 19 rows until it gets to Other Services, with rows in column 1 (Industry) alternating between a white and a light blue background color.
After that, the two sets of columns spell out data for aggregate weekly hours and weekly payrolls, respectively, with five individual columns in each set: March 2012, January through March 2013, and a percent change from the previous month (February 2013) to the present month (March 2013).
The table footer includes three footnotes numbered 1 through 3. The special marker, (p), indicates preliminary (that is, not final) data.
Here is how you build such a table by the numbers, as it were:
The table caption can be captured inside a caption element. You can use the line break (
) element to break the line after ESTABLISHMENT DATA and before the actual detailed caption that begins Table B-9: Indexes of Aggregate. . . . Use the line break element again to break the line before stating the scale indicator “[2002=100].”All of the headings should be contained inside a element. You use the table heading (
) element for each heading cell, so it will be centered and in boldface inside each such cell. The Industry cell should take a rowspan="2" attribute so it fills the entire height of the header area at left, and the Index of . . . cells should each take a colspan="5" attribute so each one covers the four date and percent change columns for its category. All three of those items will appear in the first table heading row, each in its own table heading (
) cell. The remaining ten items appear in the second table heading row in their order of appearance in the table. Each of those ten items also appears in its own table heading (
) cell. Setting widths for the Industry and various date and percentage columns in the CSS for the header sets widths for the entire rest of the table. In the table body, one row corresponds to each line of data from the online source, starting with the industry name at left and then continuing with the numerical values for dates and percentages in each of the two groups at the right. This task involves 11 table data (
) elements for each row shown in that table. Very simple, very mechanical, very easy. The table footer entries all appear in a footer section, which should take a colspan="11" attribute to flow across the entire width of the table. The Footnotes legend can appear inside a single table row (
) and table data ( ) cell, the latter set to boldface. (Don’t use
, or the footnote text will be centered.) Each remaining footnote appears inside a single table row and table data cell as indicated in the table. By using these techniques, you can create a solid, attractive table for presenting numerical and textual data. If you take your time and think your way through what you want your users to see, you can build a preliminary structure in HTML. Then you can start arranging cells and tweaking them until you get them just right.


