Enabling the Debug Console in Safari on iPhone, iPod touch, or iPad allows you to see HTML, CSS, and JavaScript errors directly in the device. This is the most reliable way to ensure that you have no surprise issues to resolve when you do your final testing.
To enable the Debug Console in Safari, follow these instructions.
Tap the Settings icon on the iPhone or iPad desktop.
The Settings screen opens.
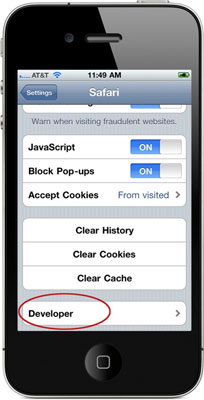
Tap to choose Safari from the list of software available on your device.

The Safari Settings screen opens.
Scroll to the bottom of the screen and then tap Developer.

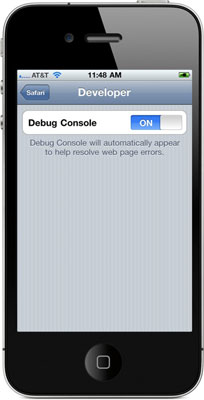
The Developer screen appears.
Touch the On button to activate the Debug Console.

After the Debug Console is enabled, Safari reports any errors it encounters when accessing a website. At the top of every web page, just under the address bar, the Debug Console reports any HTML, JavaScript, or CSS errors.


