


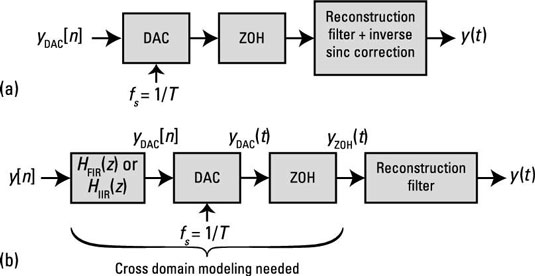
The zero-order-hold (ZOH), which is inherent in many digital-to-analog converters (DACs), holds the analog output constant between samples. The action of the ZOH introduces frequency droop, a roll off of the effective DAC frequency response on the frequency interval zero to one-half the sampling rate fs, in reconstructing y(t) from y[n]. Two possible responses are to
Apply an inverse sinc function shaping filter in the continuous-time domain.
Correct for the droop before the signal emerges from the DAC.
The system block diagram is shown here.
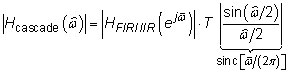
Imagine that a senior engineer asks you to investigate the effectiveness of the simple infinite impulse response (IIR) and finite impulse response (FIR) digital filters as a way to mitigate ZOH frequency droop. You need to verify just how well these filters really work. The filter system functions are
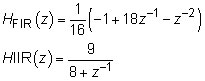
To solve this problem, you need to use the frequency-domain relationship from the discrete- to continuous-time domains. The relationship, relative to the notation of the figure, is
You can assume that the analog reconstruction filter removes signal spectra beyond fs/2.
The frequency response of interest turns out to be the cascade of
Follow these steps to justify this outcome:
Let

From the convolution theorem for frequency spectra in the discrete-time domain, get

Use the discrete to continuous spectra relationship to discover that the output side of the DAC is

Use the convolution theorem for frequency spectra in the continuous-time domain to push the DAC output spectra through the ZOH filter:

The cascade result is now established.
To view the equivalent frequency response for this problem in the discrete-time domain, you just need to change variables according to the sampling theory:
Rearranging the variables in the cascade result viewed from the discrete-time domain perspective is
The ZOH frequency response is
Putting the pieces together and considering only the magnitude response reveals this equation:
To verify the performance, evaluate the sinc function and the FIR responses by using the SciPy signal.freqz() function approach of the frequency domain recipe. Check out the results in the following figure.
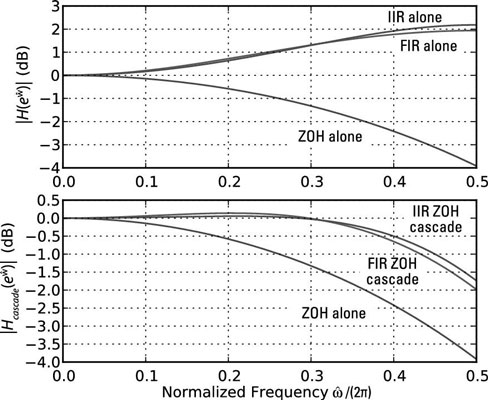
In [<b>393</b>]: w = linspace(0,pi,400)
In [<b>394</b>]: H_ZOH_T = sinc(w/(2*pi))
In [<b>395</b>]: w,H_FIR = signal.freqz(array([-1, 18,-1])/16.,1,w)
In [<b>396</b>]: w,H_IIR = signal.freqz([-9/8.],[1, 1/8.],w)
In [<b>402</b>]: plot(w/(2*pi),20*log10(abs(H_ZOH_T)))
In [<b>403</b>]: # other plot cammand lines similar
In [<b>412</b>]: plot(w/(2*pi),20*log10(abs(H_FIR)*abs(H_ZOH_T)))
These results are quite impressive for such simple correction filters. The goal is to get flatness that’s near 0 dB from 0 to π rad/sample (0 to 0.5 normalized). The response is flat to within 0.5 dB out to 0.4 rad/sample for the IIR filter; it’s a little worse for the FIR filter.


