


You can use the adjusted coefficient of determination to determine how well a multiple regression equation "fits" the sample data. The adjusted coefficient of determination is closely related to the coefficient of determination (also known as R2) that you use to test the results of a simple regression equation.
The adjusted coefficient of determination (also known as adjusted R2 or
pronounced "R bar squared") is a statistical measure that shows the proportion of variation explained by the estimated regression line.
Variation refers to the sum of the squared differences between the values of Y and the mean value of Y, expressed mathematically as

Adjusted R2 always takes on a value between 0 and 1. The closer adjusted R2 is to 1, the better the estimated regression equation fits or explains the relationship between X and Y.
The key difference between R2 and adjusted R2 is that R2 increases automatically as you add new independent variables to a regression equation (even if they don't contribute any new explanatory power to the equation). Therefore, you want to use adjusted R2 with multiple regression analysis. Adjusted R2 increases only when you add new independent variables that do increase the explanatory power of the regression equation, making it a much more useful measure of how well a multiple regression equation fits the sample data than R2.
The following equation shows the relationship between adjusted R2 and R2:
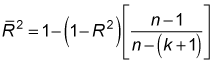
n = the sample size
k = the number of independent variables in the regression equation
For example, suppose that the Human Resources department of a major corporation wants to determine whether the salaries of its employees are related to the employees' years of work experience and their level of graduate education. To test this idea, the HR department picks a sample of eight employees randomly and records their annual salaries (measured in thousands of dollars per year), years of experience, and years of graduate education.
This figure highlights a section of the regression statistics from an Excel spreadsheet based on this study.
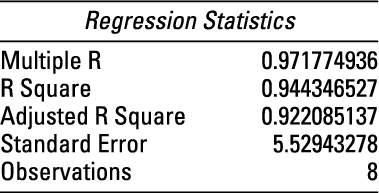
R2 is found in the figure; it's labeled "R Square" and equals 0.944346527. The sample contains eight observations, and there are two independent variables (years of experience and years of graduate education). The figure shows the adjusted coefficient of determination (Adjusted R Square) as approximately 0.922. This is computed as follows:
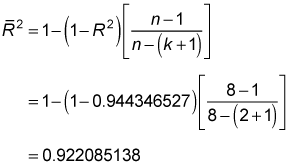
(This equals the value in the figure except for a slight rounding difference.)
The range of possible values for the adjusted coefficient of determination is from 0 to 1; in mathematical terms,
Based on the value of adjusted R2, the proportion of variation explained by the estimated regression line is approximately 0.922 or 92.2 percent. Thus, the estimated regression equation fits or explains the relationship between X and Y.


